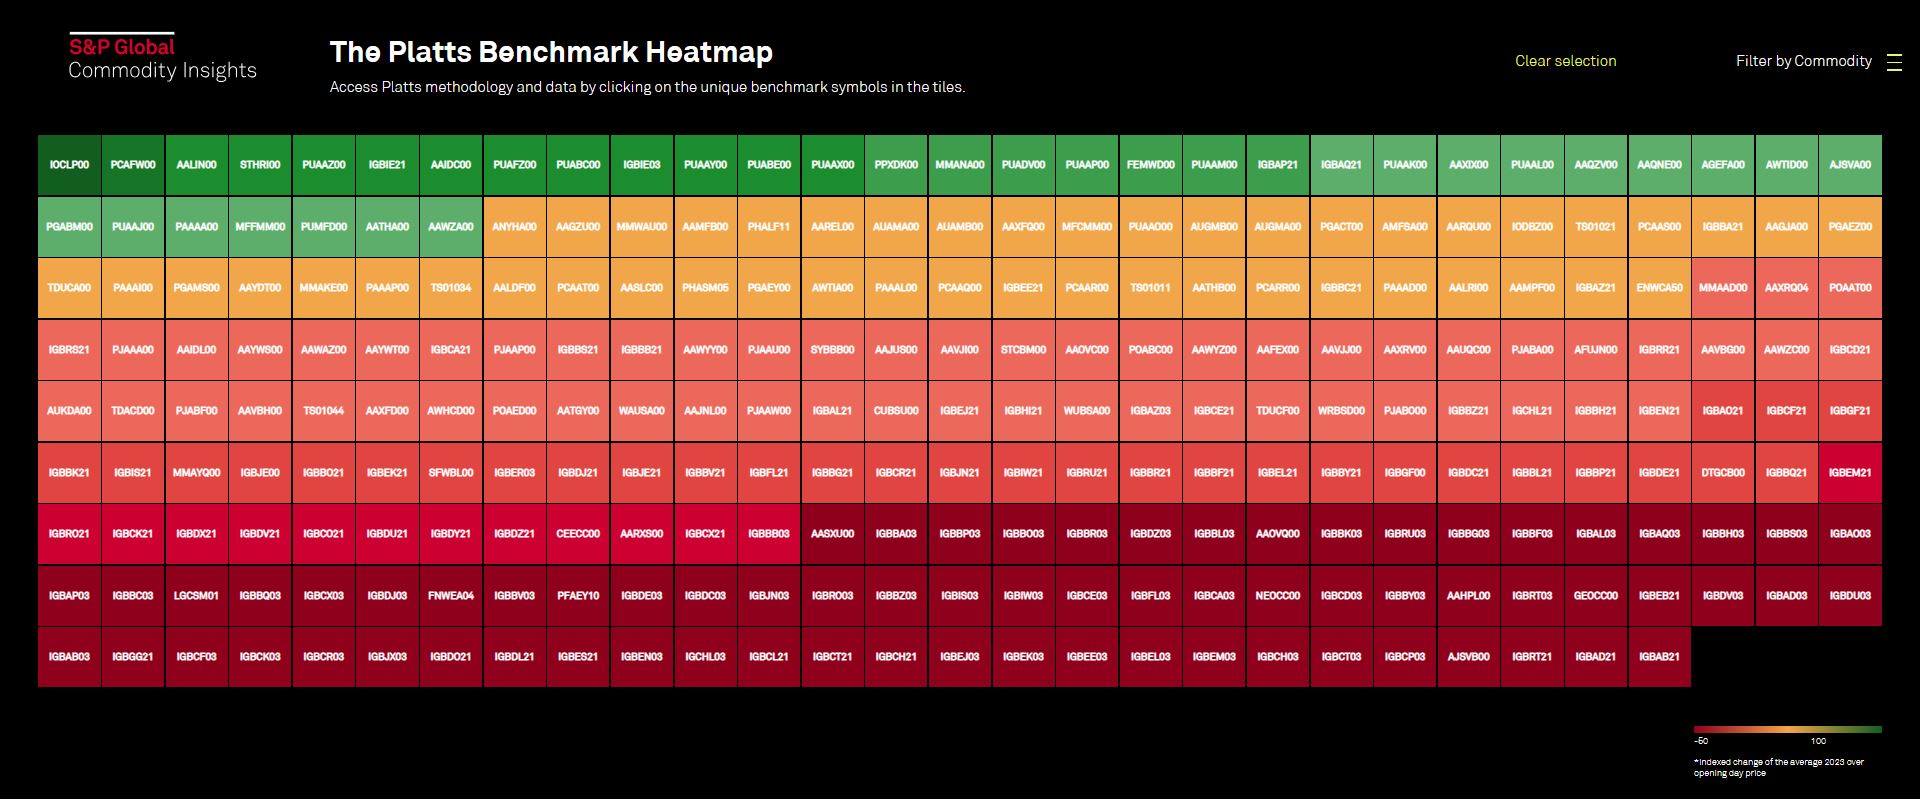
The price wall visualizes 258 of the most important price benchmarks assessed by Platts across various commodities from crude through to chemicals, LNG and carbon.
The wall shows the price performance of these benchmarks over 2023 based on their indexed value from the first day of trading.
Click on the commodity button to isolate different groups of resources to see which performed best in 2023, a year that saw dramatic changes in trade flows and demand because of sanctions and price caps on Russian commodities and a recovering post-COVID global economy.
Isolate individual benchmarks by clicking on the tile to reveal a unique QR code to navigate to specific Platts methodology pages and average price data for 2022 and 2023.