Accounting Carbon Emission Cost for Future Energy Transition and Sustainability
<span/><span/>Global carbon emission has dropped substantially due to coronavirus (COVID-19) that has curbed the demand of transportation fuels and business activities temporarily. However, the energy and petrochemical industries need to look beyond this pandemic and continue the efforts to drive higher energy efficiency and control global warming for a sustainable future. Also, industry needs to move beyond simply estimating carbon emission to focus on how accounting for carbon emission cost will impact the production cost and profitability of a company's process or business.
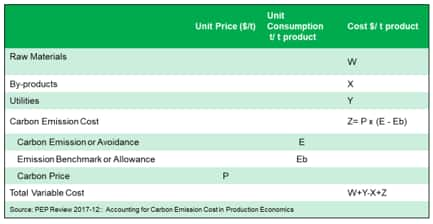
Traditionally, variable costs for energy and chemical production include raw materials, utilities, and by-product credits. To ensure a sustainable future carbon emission cost or avoidance credit needs to be factored in as the fourth category and accounted for in a quantitative way for a more precise assessment of business impact, as explained in the following table.

Figure 1: Accounting for Carbon Emission Cost in Production
Economics
Where W is the sum of unit consumption times unit price of all raw materials, counting as cost. X is the sum of unit production times unit price of all by-products, counting as credit. Y is the sum of unit consumption times unit price of all utilities, counting as cost. Utilities can include fuels, electricity, steam, cooling water, process water, etc. The traditional total variable cost is calculated as W+Y-X.
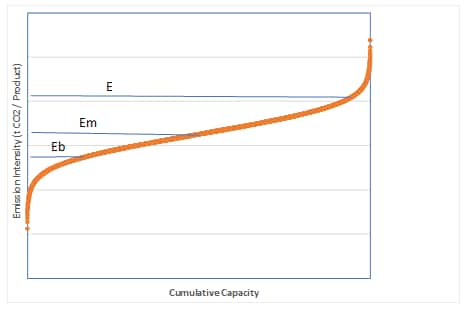
When carbon emission cost is added as the fourth category of variable cost, there are three important factors: emission allowance or benchmark (Eb), total carbon emission of the process (E), and carbon pricing (P). A possible way to set the benchmark is shown in the following figure.

Figure 2: Cumulative capacity
The carbon emission intensity ( ton CO2 emission/ ton of product) of all competing processes is plotted against cumulative production capacity similar to production cost curve (Ref. CCMA). If the medium carbon emission intensity (Em) is selected as the benchmark, half of the capacity will be above the benchmark and must pay for the emission and that other half is below it and will receive a credit. The industry would stay at carbon neutral status. To ensure long term reduction of net carbon emission, the benchmark (Eb) needs to be set below the medium emission intensity and gradually move lower every year . The lower carbon emission intensity is set as benchmark, the more aggressive is the carbon reduction goal.
In most cases, when a process does not consume CO2 as a raw material or capture CO2, carbon emission for a process E is generally a positive number. If the carbon intensity E is greater than Eb, E-Eb is positive, and the process will pay for excess emission and thus an additional cost. On the other hand, if a process emission E is less Eb, E-Eb is negative, the process will get a credit for having lower emission intensity than the benchmark.
However, E can also be a negative number if the process consumes CO2 as a raw material such as in the urea production or CO2 is captured by a CCSU (carbon capture storage and utilization) process that avoids carbon emission and should receive a credit. For a biochemical or biofuel process, when a biomass is used as a raw material, if there is a direct CO2 emission from the process such as in fermentation, the amount of process emission is waived and subtracted from the total emission E of the process, since it is assumed that CO2 is temporarily released from the biomass to the atmosphere and can be reabsorbed by other plants within a reasonable time period. Carbon emissions due to fuel and electricity consumption in a biobased process are still needed to be assessed.
By adding carbon emission as the fourth variable cost category, the total variable cost is calculated as W+Y-X+ Z, where Z= P x (E-Eb), and it can be positive (a cost) or negative (a credit). The total variable cost will trickle down to cash cost by adding fixed (operating and maintenance) costs and to total production by further adding depreciation and corporate overhead. Thus, the impact of added carbon emission cost will eventually impact the margins of the process or business.
The above-mentioned benchmark setting scheme has been proposed by China Petrochemical and Chemical Industry Federation (CPCIF). In Europe, where a carbon trading system has ben operating for years. The total carbon emission is controlled by gradual reduction of carbon allowances, where high emitter has to buy allowance and low emission can sell allowance. An emission benchmark is implicit in the system. For US where carbon emission trading is only established in power industry in certain regions, not for all industries. However, we believe that all companies need to quantitatively determine the potential impact of accounting for carbon emission cost for strategic and business planning purposes. The urgency of controlling climate change is mounting; it is well beyond national borders. The actions will eventually be determined by human conscience.
The proposed addition of carbon emission cost as the fourth variable cost category can also allow the policy makers to effect desired energy transition in terms its direction and speed by applying two levers: carbon emission benchmark Eb and carbon pricing P.
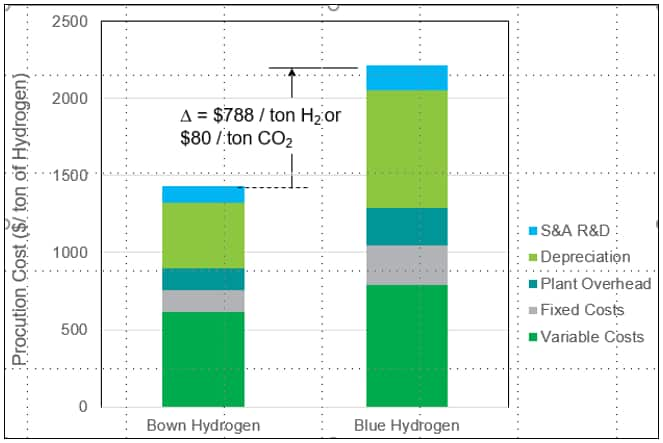
Take hydrogen production for example. Although green hydrogen production by hydrolysis of water has advanced significantly, its scale is still very small. Industry will still depend on the steam reforming of natural gas to produce large quantity of hydrogen for hydroprocessing in the refineries. Large quantity of hydrogen will also be needed to make fuel cell based transportation possible in the future. But natural gas reforming has a large carbon intensity per ton of hydrogen production. It's thus called brown hydrogen. To meet the large volume hydrogen requirements in a sustainable way, there has been a lot of interest in blue hydrogen production by capture and sequester CO2 produced in the brown hydrogen. However, our recent study in Q1 2019 has shown that based on the prevailing technology with high capital investment cost, blue hydrogen production by carbon capture is estimated to increase $788 per ton of hydrogen, or $80 per ton of carbon capture on the total production cost basis as shown in the following graph.

Figure 3: Blue hydrogen production
The analysis shows that to incentivize the blue hydrogen production, policy maker needs to grant a credit of $80 per ton of carbon capture to make blue hydrogen competitive to brown hydrogen, at least initially. This credit can be gradually reduced to encourage future technology innovation. This example demonstrates that the detailed accounting for carbon emission cost in the overall production economics can provide a quantitative tool for policy makers to steer the future energy transition in a more targeted and deliberate way.
IHS Markit experts are available for consultation on the industries and subjects they specialize in. Meetings are virtual and can be tailored to focus on your areas of inquiry. Book in a consultation with RJ Chang.
RJ Chang is vice president of Process Economics Program at IHS Markit.
Posted 27 July 2020
This article was published by S&P Global Commodity Insights and not by S&P Global Ratings, which is a separately managed division of S&P Global.

