Appalachian production growth since 2014 has been enabled by expansions on existing systems and by new pipes
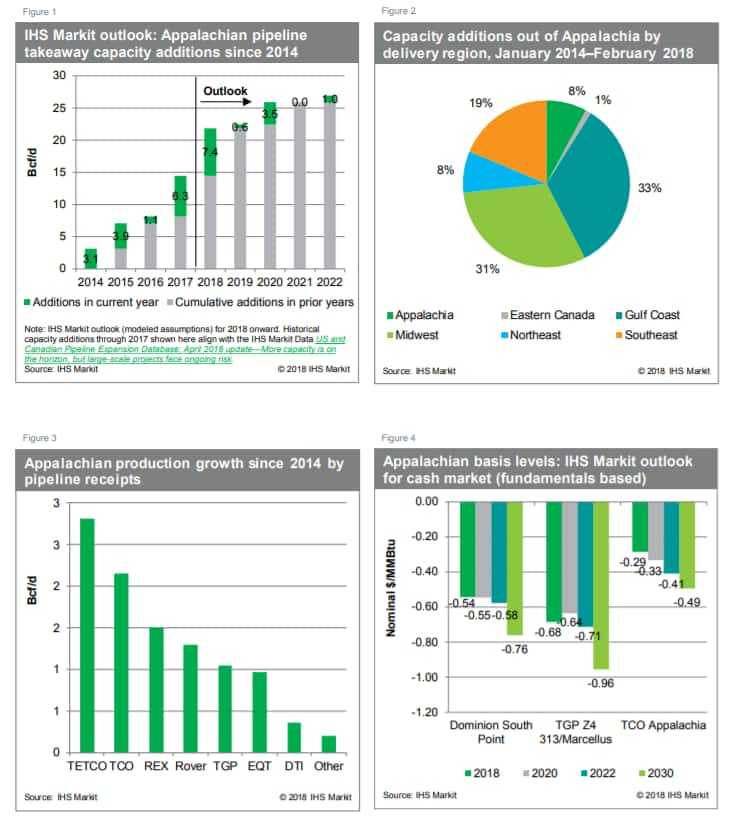
The timing and volume of Appalachian grid expansions-providing new pipeline takeaway capacity to downstream markets or expanding supply outlets within Appalachia-is critical in driving the pace of regional production growth and basis levels. We estimate that pipeline expansions entering service in January 2014- February 2018 have provided 14.5 Bcf/d of new capacity for Appalachian gas to reach local and downstream markets, with about half of this capacity delivering to the Gulf Coast and Southeast; 4.5 Bcf/d serving the Midwest; and more than 2.0 Bcf/d directed to Appalachia and the Northeast (see Figures 1-4).
Pipes that already link south to north (traditionally carrying Gulf Coast production to north-eastern markets) have been able to exploit the potential for reversals to enable Appalachian production to flow to growing markets in the South. For example, most of the TETCO expansion capacity brought online in 2014-17 delivers to the Gulf Coast and Southeast markets (more than 2.0 Bcf/d out of nearly 3.0 Bcf/d), and about one-third of the TETCO expansion capacity has been done through reversals-including TETCO OPEN (0.6 Bcf/d), Adair Southwest (0.2 Bcf/d), and Access South (0.3 Bcf/d). Similarly, the integrated TCO and CGT systems have brought online significant north-to-south capacity from Appalachia, including more than 1.0 Bcf/d of capacity to the Gulf Coast via the Leach XPress and Rayne XPress projects (in full service as of January 2018).
Including major new systems such as Rover, four pipelines (TETCO, TCO, REX, and Rover) account for about 75% of the production growth from 2014 through February 2018. These pipelines have added 0.5 Bcf/d of intraregional capacity (serving the local market) and 7.7 Bcf/d of takeaway capacity out of Appalachia. These projects include the REX Zone 3 Capacity Enhancement serving the Midwest (0.8 Bcf/d, January 2017) and, more recently, the start of deliveries to the Gulf Coast and Midwest via Rover. We estimate that Rover is currently flowing about 1.5 Bcf/d.
Future production growth is likely to remain concentrated on pipelines adding connectivity to downstream markets directly or indirectly through coordinated expansions with systems exiting the region. The importance of pipelines' demand profiles and linkage to downstream markets is evidenced by the price differences for Appalachian gas among the region's different pipelines, with Columbia Gas Transmission Appalachia continuing to price above other supply in the region (such as Dominion South Point) because of its significant, direct access to downstream markets.
The timing of large-scale projects remains uncertain
Regulatory risk for new large-scale greenfield expansion projects is growing as local residents and environmental groups question the traditional value proposition that lower natural gas and power prices are socially beneficial. Given these uncertainties, for 2018-22 we currently assume that expansions will provide an additional 12.5 Bcf/d of exit capacity out of Appalachia to downstream markets. This is below the estimated announced incremental capacity of nearly 14.0 Bcf/d for this period (of which just over 10.0 Bcf/d has been contracted).
Our current outlook assumes that Rover reaches full service (including Michigan/Ontario capacity of 1.3 Bcf/d) this summer, as does Transco Atlantic Sunrise (1.7 Bcf/d), with the NEXUS project (1.5 Bcf/d) assumed to enter service in November 2018. This outlook will likely evolve as the various projects negotiate the new regulatory juggernaut.

Figures 1-4: Appalachian pipeline expansions drive production and basis
For the Northeast, Enbridge's 133 MMcf/d Atlantic Bridge project is partially online and should ramp up to full service over the next year or so. Nevertheless, given the political and environmental opposition to new build in this region, our outlook currently assumes no additional capacity from Appalachia to the Northeast through 2040. Despite the challenges to building new capacity into the Northeast, power reliability concerns and $180/MMBtu winter gas prices have pipeline companies continuing to pursue expansion projects.
In the 2020s, Appalachian takeaway options reaching farther afield are expected to diminish rapidly
IHS Markit estimates that continued Appalachian production growth will eventually require another wave of incremental takeaway capacity deeper into the Midwest and Southeast and to LNG export points on the Gulf Coast. However, as the cost for successive expansions (many requiring greenfield construction) increases, price spreads will need to expand to support project economics. We estimate that the average cost of new pipeline transport capacity (monthly reservation charges) was approximately $0.58/MMBtu per day in 2014-17 rising to $1.36/MMBtu per day in 2018-20 and could reach $1.75/MMBtu per day or more beyond the 2020s. As a result of these growing costs and other challenges to Appalachian grid expansion, we currently assume that Appalachian takeaway capacity will increase by approximately 4.0 Bcf/d in 2023-30 (compared with 26.9 Bcf/d added in 2014-22).
Learn more about our global gas news and analysis.
Anusha de Silva, Associate Director at IHS Markit, focuses on fundamentals analysis for the North American natural gas market.
Matthew E. Piatek, Director at IHS Markit, specializes in North American natural gas markets and as a member of the IHS Markit North American gas team focuses on the US Northeast, Midwest, and eastern Canada market dynamics.
This article was published by S&P Global Commodity Insights and not by S&P Global Ratings, which is a separately managed division of S&P Global.

