Can you determine production back out for a gathering system without IPRs?
Background
A gathering system is a collection of wells (or batteries) that are linked by a pipeline network, and therefore interdependent. A common objective when analyzing gathering systems is to perform "what if?" scenarios, such as twinning a pipeline or adding a compressor and then predicting what the results might be. Probably the most common "what if?" scenario is predicting production back out, which can be defined as follows:
- Currently, many wells are flowing into the gathering system, and each has a known rate
- At some point in the future I want to make a change to the gathering system
- Question: if I make this change, how much production will be lost ("backed out") from the currently producing wells?
This process of determining back out is related to performing Nodal analysis on a single well. With Nodal analysis, an inflow performance relationship (IPR) is created for the well, which might look like this:

Figure 1: IPR Curve for a Gas Well
To determine back out for a single well, you only need to know the change in pressure. For example, if the well was originally producing 2.2 MMscfd at 1000 psi(a), then it follows that if the well is operated at 1500 psi(a) then the well will only produce 1.8 MMscfd. Therefore, the back out caused by a 500 psi increase in operating pressure is 0.4 MMscfd.
For a gathering system, back out can easily be determined if each well has an IPR curve. However, determining an IPR curve in the first place is not always easy. A gathering system might have dozens of wells (or hundreds), so determining an appropriate IPR curve for each well might not be trivial task. Furthermore, if you have unconventional wells then determining an appropriate IPR curve is even more difficult.
However, all is not lost. You can still take an engineering approach to the problem and obtain useful information very quickly by modelling a gathering system without any IPRs at all.
Problem Description
A client has many unconventional gas wells in an existing gathering system. These wells are grouped into pads, so that five wells deliver into a given pad. A diagram of this gathering system follows:

Figure 2: Current Gathering System
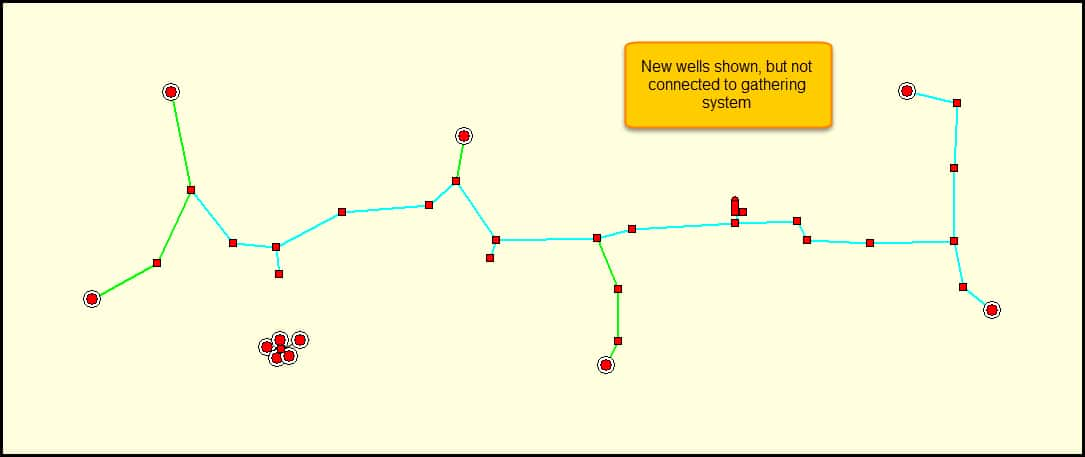
A new pad of wells is planned to be drilled in the southwest area of this map, and the plan is to tie those wells into this gathering system. However, the production engineer is unsure about a few things, including the best location to tie the wells into the system, and how much back out will be seen by the existing wells.
Methodology
One approach to this problem is to develop an analytical model for each of these wells using RTA methods, and then import those models into the system and run a forecast both before and after the new pad is tied in. However, models have not yet been built for all of these wells, and the production engineer does not wish to wait until all of them have been completed.
Another approach would be to generate IPR curves for these unconventional wells. However, that has been deemed equally difficult since the current average reservoir pressures cannot easily be determined.
Therefore, the following approach has been identified:
- Build the current system with fixed deliverability wells
- Calibrate the system so that pressure losses in the pipelines are calculated within a reasonable level of error
- Save a copy of the current calculated wellhead pressures
- Build the new pad of wells into the model, and attach them to the gathering system
- Also, multiple attachment points will be tested
- Calculate the wellhead pressures after the new pad has been tied in
- Determine the change in wellhead pressure
- For a small pressure change, then likely only a small rate change will occur
- Likewise, for a large change in pressure then a larger change in rate is expected
- Identify which wells would see the larger pressure change
- Model these wells in more detail
The IHS Markit Piper software is ideally suited to this type of analysis, since it contains the ability to model wells with fixed deliverability and has several built-in tools to show the change in wellhead pressure. Furthermore, if certain wells are later identified as being critical for further analysis, then those wells can have an IPR curve created directly in the software, or can have an Analytical Model imported directly from the IHS Markit Harmony RTA software.
Example Procedure
For simplicity, the gathering system was built in IHS Piper so that each pad of wells was reduced to a single "well" that represents each pad's production. The system was then calibrated so that the pressures calculated at each pad were the same as the measured pressures. The following diagram shows the system in this current baseline state:

Figure 3: Calibrated System with Pads- this is the "Baseline" system
Since IHS Piper can handle multiple scenarios in the same project, a second scenario was created with the planned wells shown.

Figure 4: Location of planned wells
Based on the location of the planned wells, the shortest pipeline to connect these wells to the gathering system would be laid in a direct north-south orientation.

Figure 5: Planned wells connected to system
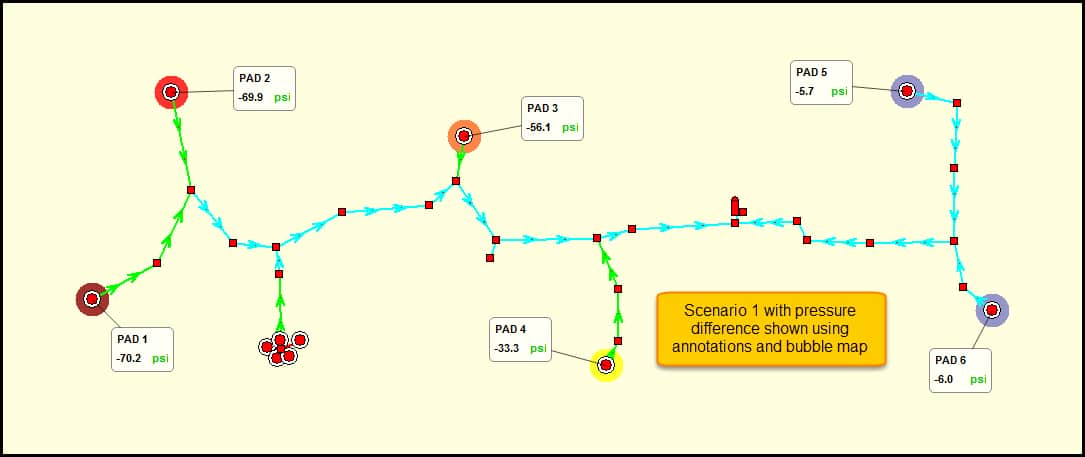
With the planned wells attached to the system, the pad pressures can again be calculated and a delta pressure can be determined. IHS Piper is especially appropriate for this task, since the range of "baseline" pad pressures can be entered into the project and compared with the new scenario.
Additionally, Piper has several ways to show this pressure differential. The following diagram shows two of these methods:
- Using a bubble map to show pressure differential by way of color range
- Using annotations to show absolute pressure differential

Figure 6: Pressure difference
Both methods have their advantages. Using annotations, the exact pressure difference can be seen, which is obviously useful. However, if you have hundreds of wells on screen, sifting through raw numbers can be time-consuming. This is where the power of the bubble map is apparent, since groups of wells with lower (or higher) differentials can quickly be identified by eye.
Results
In this scenario, Pad 5 and Pad 6 are minimally affected by the addition of a new pad, and will therefore experience negligible backout.
On the other hand, Pads 1-4 all experience a noticeable increase in pressure, from ~33 psi to ~70 psi. Without knowing the inflow performance relationship of each pad (or attached wells), it is impossible to quantify the back out. However, it is possible to qualify things, in that Pad 1 and Pad 2 will see the most pressure change at the wellhead, while Pad 4 will see less than half the pressure change that Pad 1 will see. Therefore, a discussion can be had with some reservoir engineering colleagues to determine whether a 70 psi (or 33 psi) change in wellhead pressure will have a tangible effect on rate, and whether that change is acceptable or not.
Also, if the production engineer is still responsible for quantifying back out, then at least Pad 5 and Pad 6 can be exempted from the workload of creating a model or IPR curve.
Alternate Scenarios
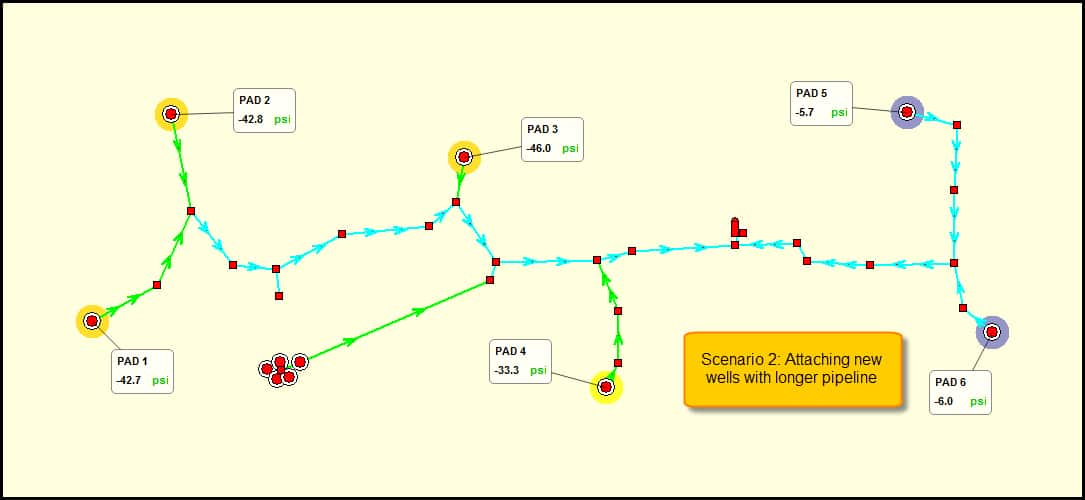
In the example, the planned wells were attached with the shortest possible pipeline. But what if these wells were attached at a different location, what would the effect be then? A second scenario is shown where the wells are connected slightly to the east:

Figure 7: Attaching planned wells closer to delivery point
This scenario appears to have a much smaller effect on Pads 1 and 2, since there is less friction in the main trunk line.
Conclusions
Determination of back out is a common objective in gathering system analysis. The only way to fully quantify back out is by knowing the deliverability of every well in the gathering system, either through models or IPRs. However, using simple engineering methods, the amount of work required can be substantially reduced through the use of fixed rate wells, and then spending time on modelling only the wells that will experience a substantial pressure change.
This methodology can also be adapted to any back out project, whether the objective is to add more rate to the system, or to remove capacity. For example, if a cost-saving project is attempted, such as eliminating a compressor, pump, or even processing plant, this methodology will work equally well in providing quick results to pinpoint where further engineering analysis is needed.
Simon Davies is a Principal Analyst at IHS Markit.
Posted 14 March 2017
This article was published by S&P Global Commodity Insights and not by S&P Global Ratings, which is a separately managed division of S&P Global.

