The future of conventional exploration
An array of political, market, and strategic factors will drive exploration activity over the next five years. Demand will contract due to coronavirus (COVID-19), the Vienna Alliance price war and the ensuing supply overhang will impact markets well in 2021. Critical questions arise when we look at the future of exploration activity—what will conventional exploration drilling (New Field Wildcat wells; NFWs) and discoveries look like in the base case and low case? Hear our basins experts analyze the future of exploration.
The graph below shows our price outlook through 2021. The upper green bar is an optimistic rebound in price, which is probably not a viable alternative at this point given the fact that we're close to $20 a barrel already. But the green would say that the OPEC alliance kiss and make up and that coronavirus is not as serious as we think it is. The blue line is somewhat intermediate. It says, "okay, coronavirus hits us, the Vienna Alliance may make up or not," but what happens is there is a rebound in price from the end of this year through next year. The red line says coronavirus visits again into the future. Vienna Alliance doesn't make up and that the price stays low for a while.
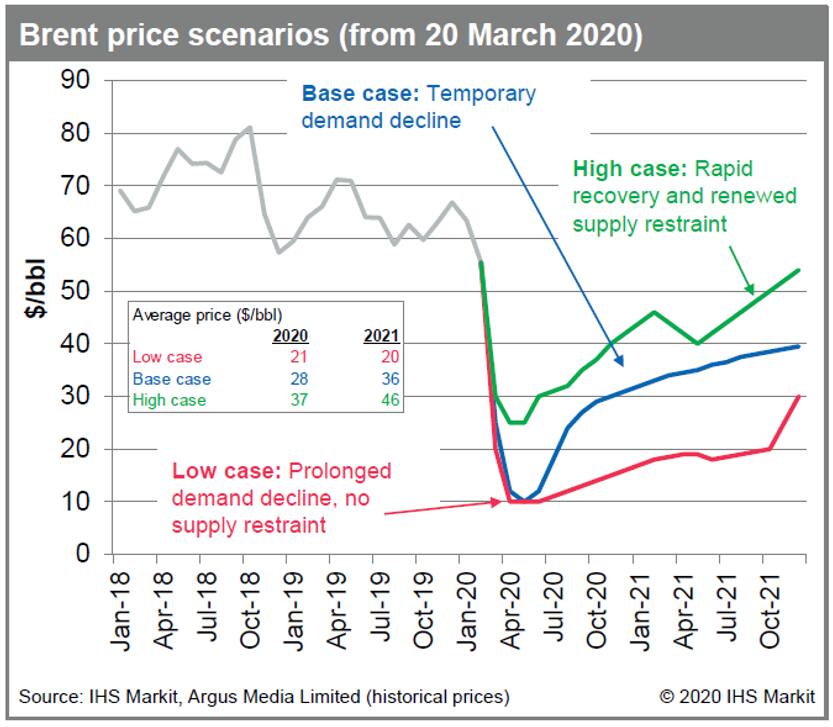
Figure 1: Brent prices scenarios (from 20 March 2020)
Which case do you think companies are going to plan for? We believe most people are going to plan for the red line, though our assumptions going forward is kind of the red line. Even if the blue line turns out to be true, we think exploration will be dampened because it's the most discretionary part of upstream spending. However, some companies may differentiate themselves and they say the price is going to return to $50 or $60 a barrel.
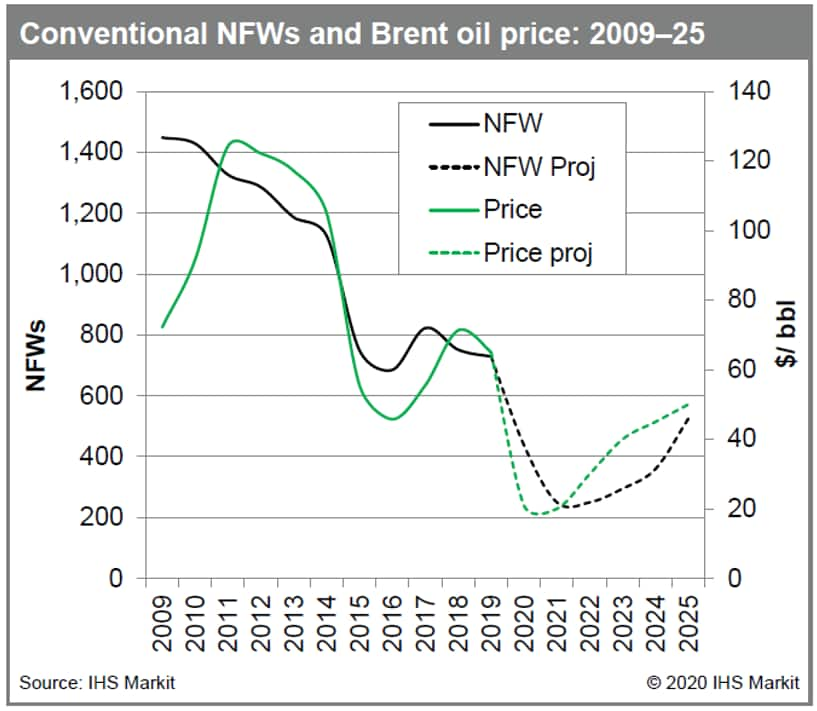
Figure 2:Strong correlation between oil price and
NFWs will continue.
The graph above shows the relationship between price, the axis on the right, and new field wildcats, the axis on the left. The green line is Brent oil price. The black line is new field wildcats. If you go back to 2014-2015 where we saw a 2-3 million barrel a day over supply, the number of wildcats decreased by 40%. This suppression in price is likely to be much greater. We're looking as much as a 16-million-a-day oversupply globally. Storage would be filled by the second quarter. The Vienna Alliance is likely to continue to be in disarray, and so we're likely to see a bigger drop in wildcat drilling than we did in the 2014-2015 period. It will be 60% or more through 2021 - it could be as much as 80%.
Longer term there'll be concerns over the energy transition and the lack of influence over Middle East production that may reduce exploration activity further. The world has about one trillion barrels of developed but unproduced oil. By just simply lowering the RP ratio in the Middle East countries we could increase production in some cases to double it like in Saudi Arabia just by decreasing the RP ratio from 60 to 30. That is going to be a lingering doubt when we start to recover in 2023-2024. Though there is a possibility that the reduction in wildcat drilling will be even greater than what we're projecting in this model.
There's a relationship between price and wildcat drilling, and there's a relationship between wildcat drilling and discoveries. The blue line shows wildcats drilled per year and it's extrapolated by the black dashed line out to 2025. Then in purple below is the oil and gas discoveries that would result. Normally the ratio between the oil and gas discoveries is 40% oil and 60% gas. There is no reason to think that's going to change going forward.
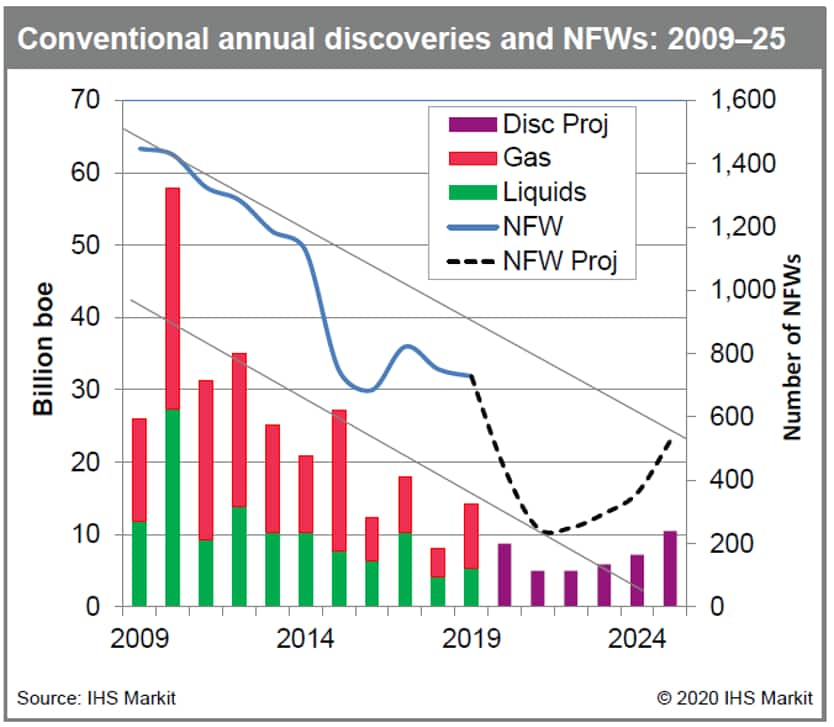
Figure 3: Downturn in conventional exploration followed by a
gradual recovery
The model above is based on the fact that we've had this (COVID-19) outbreak and the Vienna Alliance is falling apart. And it addresses both the downside case and the base case. We think in both those cases we'll see a suppression of exploration. Maybe a little bit different in one case versus the other, but people are going to plan for the worst. 60% or more decrease in drilling and, therefore, discoveries in the 2020-2021 period. However, we do see that there will be an increase in drilling, increase in activity, but it will not get to the level that we were in 2014 to 2019. We see a continuation of this downward trend that you see by the two bars. A continuation of downward trend because there's other factors. There's the competition from the conventionals and there's competition from the renewables. People are moving into a new energy transition. That's going to provide competition for capital.
If you take the fact that we're oversupplied in the short term as much as 16 million barrels a day oversupply, the Vienna Alliance is falling apart, what principles fall out of that that would drive investment and individual basins by individual companies? This is a first pass list at some of those drivers that would enable you to say this basin is going to be more heavily explored than another basin. This company is going to do more exploration than another company. It was used to differentiate basins and companies.
Analysis at the basin level
Future new field wildcats at the basin level are estimated based on the top down factors: political, market, and strategic, and how they will shape exploration activity. A basin-by-basin analysis allows observations about maturity, favorability, numbers of basins explored in, and terrain types. Globally, we estimate about 125 basins that's favorable out of 2,500 basins in the world. It's a very select few number of basins. It covers 4% of the global surface area, and it's responsible for 85% to 90% of discoveries.
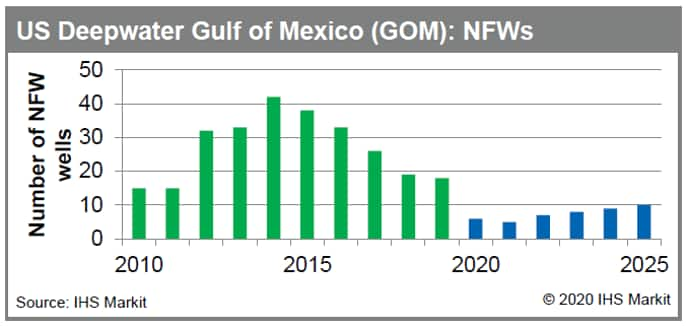
Figure 4: US Deepwater Gulf of Mexico (GOM): NFWs
Dividing things up into a basin by basin, we can look at things like basin maturity, whether it's in the frontier stage, whether it's a new emerging or maturing or rejuvenation. We can look at it as our favorability characteristics. Those are both geological and commercial. Is it favorable for exploration? We can look at the number of basins that we explore in.
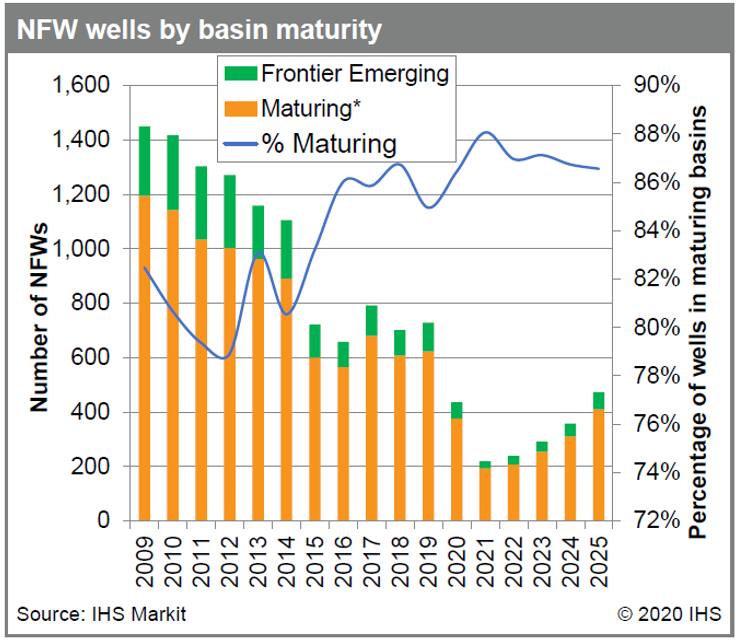
Figure 5: NFW wells by basin maturity
The above table looks at the drift or the shift between frontier and emerging basins and maturing basins. The graphic on the right, the orange is the number of wildcats in maturing basins. The green is the number of wildcats in frontier and emerging. Once again, frontier is the before the first commercial discovery. Emerging is the most productive part of the basin's history where most of the big fields were discovered. Guyana Basin is an example. Maturing would be like the Viking Graben or the Gulf of Mexico where you see declining year-on-year discoveries.
What we've seen during the 2014-2019 period is a big shift. Now you look at the numbers and it's only between 80% and 86%. You see a big shift that took place towards the maturing basins because they had short-cycle times and people want their capital back quickly.
Over the next five years we see a continued shift, but not as great. One of the reasons is you're already reaching an upper limit that you can explore maturing basins, but the other is companies may be motivated to drill their obligation wells in frontier and emerging basins to hold valuable acreage. The reason of this shift even though it's small from 80% to 86% is so important, is the discoveries in frontier and emerging are 10 times the discoveries in maturing. So even slight shifts towards maturing makes a big difference in discovered volumes.
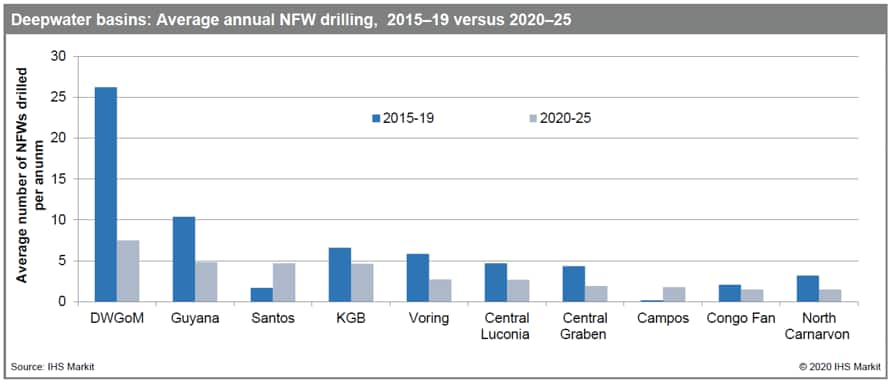
Figure 6: Deepwater basins: Average annual NFW drilling,
2015-19 versus 2020-25
This graph above looks at deep water basins. The graph is ranked by the most number of wells during this 2020 to 2025 period and it shows the difference between the average number of wells drilled per year in 2015 to 2019 versus our predictions in 2020 to 2025. You see big drops in the Gulf of Mexico. This is predicated by the fact that the Paleogene is a high-cost resource. We think that's going to dampen exploration and you're going to see a big drop.
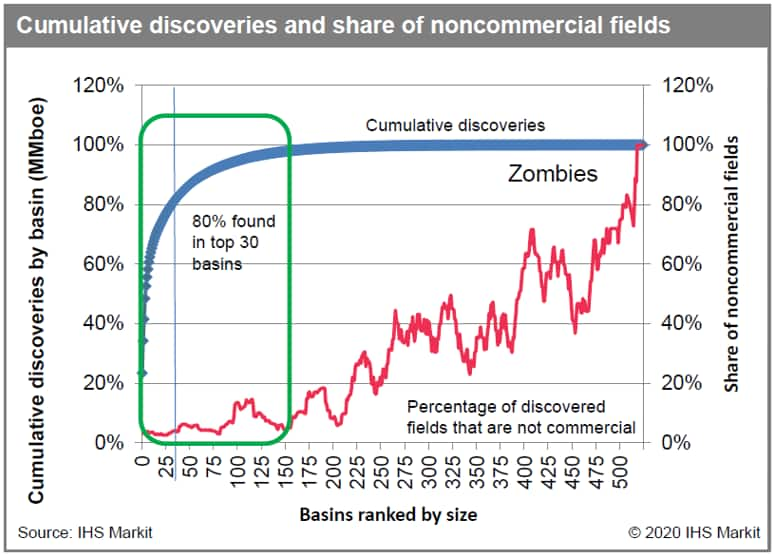
Figure 7:Cumulative discoveries and share of
noncommercial fields
Basin selection is really important. As economics go down, break-evens go down, as people start to focus on fewer basins because they don't have the manpower to focus on all basins, you will see this curve shift to the left. In the past we've been exploring approximately 150 basins - that's going to collapse to around 100 basins. Which basin you explore in, really becomes important.
Once again our projection from 2024, we're showing a decrease in drilling, decrease in discoveries and in many ways this is on trend with the trend that's been in place since 2010. At least we're going to see some rebound in discoveries and rebound in drilling, but it won't exceed what we saw in the 2015-2019 period.
There's a ray of political, market, and strategic forces that stem from this; that companies are going to react to that differentiate companies and differentiate basins and that's what we're attempting to look at now. Combination of the destruction of the Vienna Alliance and COVID-19 has driven this decline. We see wildcats drilling 60% or more. As price recovers, we could recover, but not to the 2015-2019 level.
Finally, we think there's going to be fewer E&P companies and fewer basins. Some are going out of business, and some are just going to focus on the production portfolio.
Discover more about our basin-level evaluations service.
Hear our basins experts analyze the future of exploration.
Keith King is a Senior Advisor for the Plays and Basins
team at IHS Markit.
Jerry Kepes is a Vice President for the Plays and
Basins team at IHS Markit.
Posted 16 April 2020.
This article was published by S&P Global Commodity Insights and not by S&P Global Ratings, which is a separately managed division of S&P Global.
