How do interconnection costs vary across the US Mid-continent?
Interconnection queues and study cycles are growing rapidly, challenging the ability of system operators to keep up with new requests. This bottleneck poses a looming challenge to achieving renewable policy goals, while rising uncertainty over cost expectations and timelines is becoming a pain point for project developers.
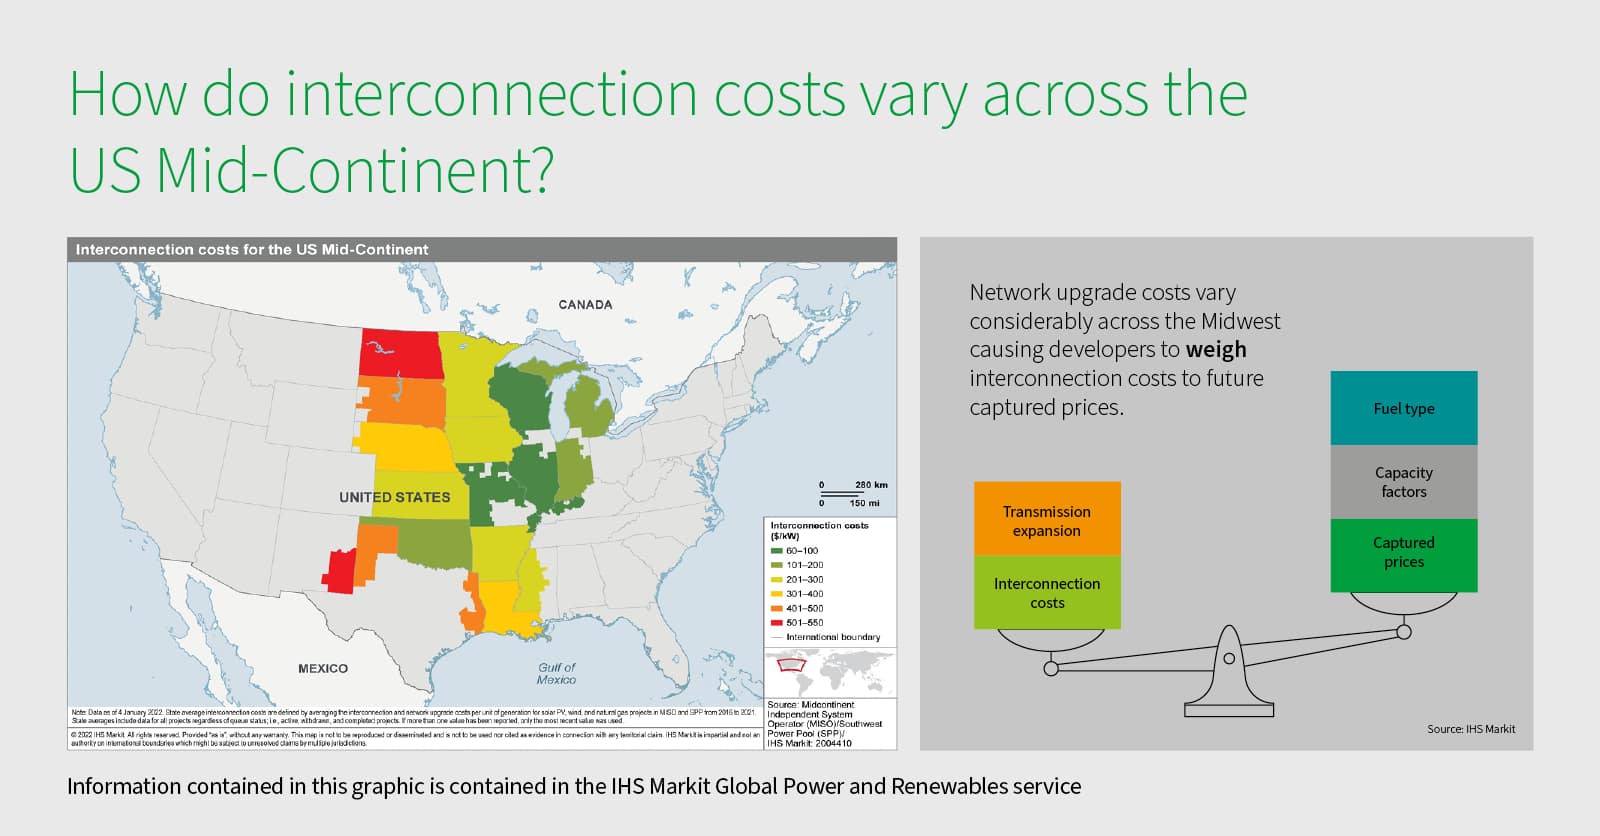
To better understand how network upgrade costs are impacting project development IHS Markit has analyzed interconnection studies from the past five years in MISO and SPP. Figure 1 displays the average interconnection costs per state. Data from over 1300 wind, solar PV, and natural gas projects have been analyzed and the state averages include projects that have been realized, withdrawn, and ones still in the queue process.

Among our many findings are that interconnection costs in load centers in the eastern part of MISO are significantly lower than in more remote regions with costs in North Dakota, for example, being on average five times higher compared to Illinois. The high averages in the Dakotas are largely associated with wind projects while higher interconnection cost in New Mexico and Texas are primarily due to solar projects. One reason for this disparity is that good resource areas near available transmission or load centers are typically the first to be developed. Thus, projects located in more remote regions of the US can be quoted with significant network upgrades.
Network upgrade costs assigned to a project can be hard to predict because of their dependence on other unbuilt generators and transmission lines. We find that developers have started entering the same project to the same interconnection queue, but at different locations to weigh upgrade costs against projected captured prices and capacity factors. While this approach may be useful to developers seeking to understand locational tradeoffs, it is only exacerbating the congestion in interconnection queues, leading to further delays.
We also find that many project owners are looking at retired points of interconnection to build new resources, which can save the project a significant amount and reduce the need for new transmission lines. With the rapid retirement of coal resources across the mid-continent over the next decade we expect this trend to continue.
The federal government is aiming to alleviate some of these bottlenecks and speed up the deployment of renewable resources with the new federal task force on transmission. However, it remains to be seen how upcoming policy changes will influence interconnection costs and whether they can meaningfully reduce the uncertainty in the project development process.
IHS Markit closely monitors the global energy transition, publishing data, key insights and market analysis. Learn more about our research.
This article was published by S&P Global Commodity Insights and not by S&P Global Ratings, which is a separately managed division of S&P Global.

