The low oil price environment: Shifting China’s 2020 gas cost curve
The global oil market is finding itself in a truly extraordinary situation whereby global demand is dropping while supply floods the market. Even with the recent agreement to reduce oil production, the impact of coronavirus disease 2019 (COVID-19) on oil demand is expected to far surpass this production cut. In the current IHS Markit outlook, the Brent oil price will average below $40/bbl this year. This new oil price environment will shuffle the order of the cost curve in the Chinese gas market in 2020.

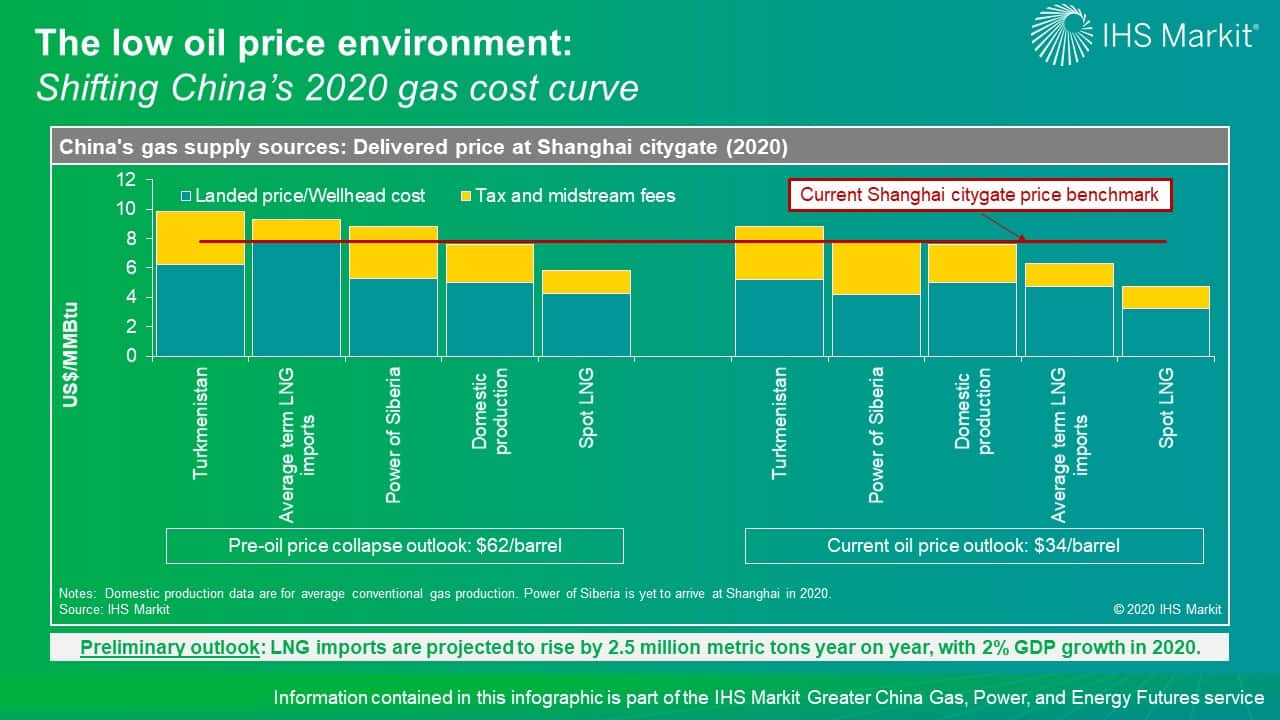
Figure 1: The low oil price environment: Shifting China's 2020
gas cost curve
Domestic production costs are expected to remain largely unaffected, but landed price for imports will fall by varying magnitude depending on contracts. Pipeline imports typically have a long lag time and single-digit percentage slopes to oil price and a high fixed-price portion for pipeline imports is generally high to account for the cost of pipeline transmission in exporting countries. On the other hand, the slopes to oil price in LNG contracts vary widely from as low as single-digit percentages to over 16%, but mostly fall in the 11-14% range, with 3-6 months typical lag time to oil price. On the delivered price basis, pipeline imports need to travel thousands of kilometers within the Chinese borders to deliver gas to coastal demand centers. LNG imports, on the other hand, have the advantage of arriving at the coast.
As a result, the oil price decline will shift China's gas supply cost curve. At the current oil price outlook for 2020, the average landed price of Chinese term LNG imports will fall by over $3/MMBtu compared with 2019. Spot prices will also be under the pressure of COVID-19-induced low gas demand growth and low-term LNG prices. On the other hand, the average landed price of Chinese pipeline imports will only decline by a little over $1/MMBtu. Bringing all national supply to the Shanghai citygate for comparison, on average, LNG imports—both term contracts and spot—are on the low end of the cost curve in 2020 in Shanghai.
Many other factors will contribute to setting the supply mix. Geographically, China is a large market and needs all supply sources to meet its regional demand requirements. In addition, domestic production in China receives strong policy support to ensure supply security, local economic growth, and tax revenue, with many targets—shale and coalbed methane production targets in particular—set for the end of 2020 under the 13th Five-Year Plan. Delivered volumes from pipeline imports may also depend on non-market factors such as Chinese companies' vested interest in upstream and midstream projects and loan repayment schedules being tied to delivered volumes. On the other hand, LNG trades will face trade disruption across the globe owing to COVID-19. In our preliminary outlook, which projects a 2% China GDP growth in 2020, LNG imports are projected to rise by 2.5 million metric tons year on year, about half of the forecast incremental LNG imports in the pre-outbreak outlook.
Learn more about our coverage of the Greater China energy market through our Greater China Gas, Power, and Energy Futures service.
Jenny Yang is a Director covering Greater China's gas
and LNG analysis.
Tianshi Huang is a Senior Research Analyst
covering Greater China's gas and LNG analysis.
Posted 20 April 2020
This article was published by S&P Global Commodity Insights and not by S&P Global Ratings, which is a separately managed division of S&P Global.


