How global integrated oil companies are dealing with the oil price downturn: Entering this downturn with weaker balance sheets
This is the first article in a three-part series covering the impact of low oil prices on global integrated oil companies. In our second article, we cover portfolio changes including conventional supply. In our final article in the series, our experts share insights on low-carbon investments.
Markets continue to fluctuate due to the blows served by Coronavirus and tanking oil prices - forcing global oil companies to quickly shift strategies. Our experts explore the financials and potential strategies to deal with the oil price collapse and compare how much capital flexibility they have now compared with the 2014 price collapse.
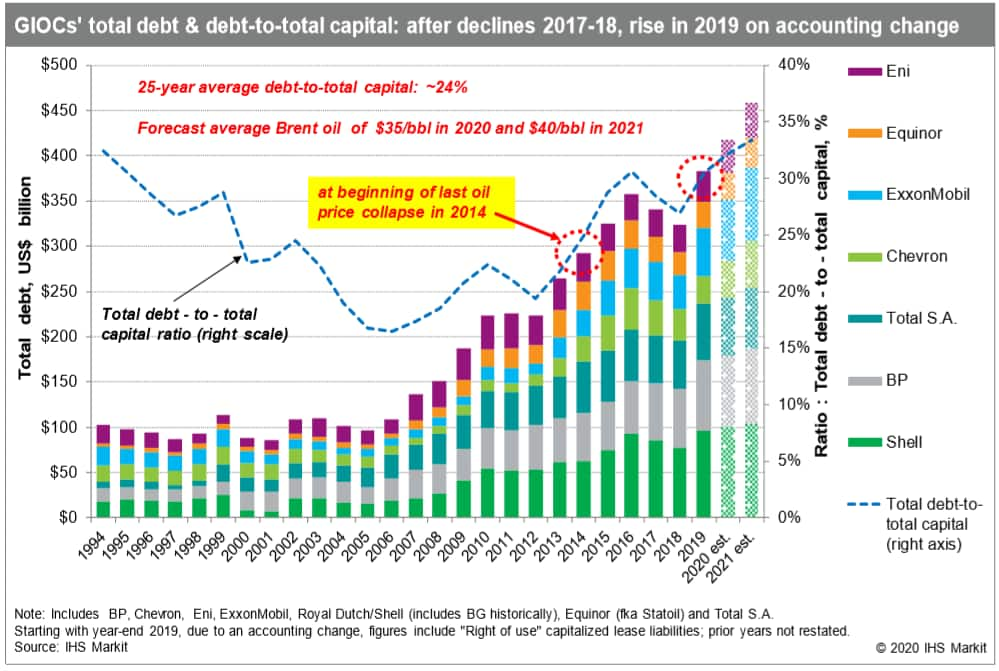
Over the past decade, global integrated oil companies (GIOCs) were in a very intensive capital investment phase with debt growing on the balance sheet. Debt levels and leverage ratios had receded from 2016 to 2018 but will be rising again owing to growing cash flow deficits due to the sharp decline in oil and natural gas prices and a plunging refined product demand globally because of the Coronavirus pandemic. Debt-to-total capital ratios are forecast to reach about 33% on average by the end of 2021 under our revised scenario, versus 31% today and 25% at year-end 2014.

Figure 1: Global integrated oil companies total debt and
debt-to-total capital
Despite all of this, most of these companies still have significant borrowing capacity. And for most companies, cash balances are lower than year-end 2014, but are still pretty healthy. This should help them maneuver through this price downturn as companies manage their cash flows and debt balances.
Capex and cash flow to tumble
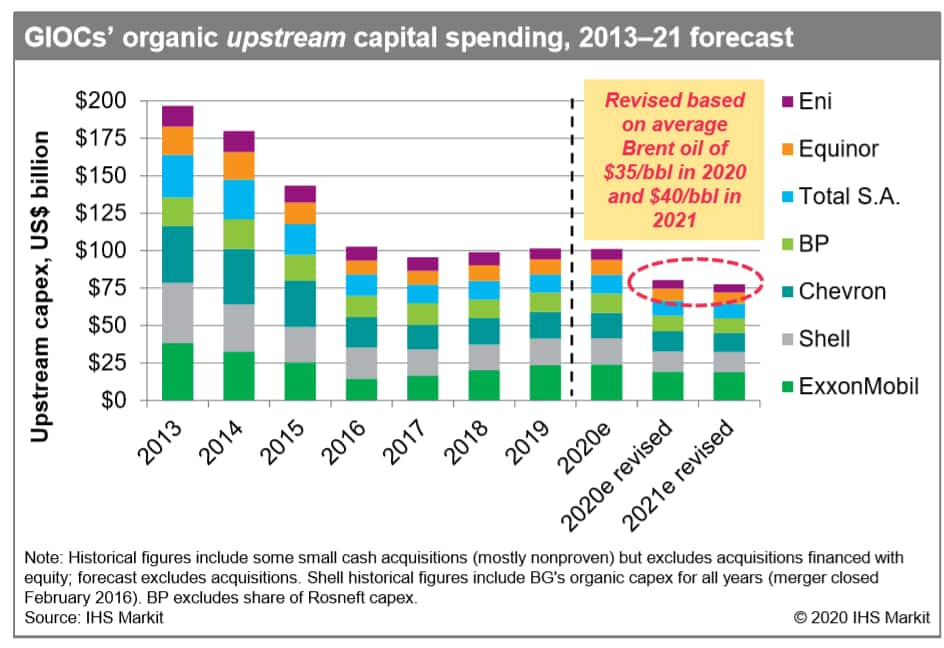
For 2020, we have a revised projection of a 20%-25% decline in upstream capex to about $80 billion for GIOCs.. The prior forecast was flat with about $100 billion in capex in 2019, still well below peak 2013 outlays during the megaproject investment period. Organic investments are still short of requirements for replacing (1P SEC basis) oil and gas production on full-cycle basis.
 Figure 2: Revised organic
upstream capital spending forecast
The GIOCs group as a whole produces about 7.6 billion BOE per year. This will require about $115 billion in annual spending using a $15 per BOE (organic 1P finding and development cost), which we think will be difficult to achieve organically owing to reduced exploration, and an insufficient inventory of quality, low cost development opportunities. That's why we think that M&A emerges will be needed longer term, but challenges remain in that space also.
When we look at the group's cash flow outlook for this year compared to the peak in 2013, we see a dramatic drop. Cash flow had been recovering for the group as a whole after bottoming out in 2016. And, with oil prices recovering in 2018 and 2019, cash flows generally had been rebounding. But again, we're looking for about a 45% decline on average for the GIOCs in 2020, owing to the collapse in oil prices, and continued margin weakness in downstream and chemicals. Overall, the group had been improving its cash flow balances and several have been generating surplus net free cash flow in recent years. But, all of the global integrators are now expected to have a significant deficits in 2020 and 2021.
Many of the global integrators announced dividend increases earlier in 2020. And that's despite weaker profits overall from those in 2019 and a poor 2020 outlook even before the price collapse in March. Weak investor sentiment for the global integrated was also reflected in the wide dividend yield spread versus 10-year treasury notes and the S&P 500. There are mounting risks on investors minds near term and long term including oil and gas price volatility, poor returns on invested capital, the energy transition and climate concerns, and the pandemic impact. The GIOCs are expected to defend their generous dividend payouts for as long as possible, as this is key to satisfying investor expectations of returning funds to shareholders. But, balancing this with capital discipline, efficient reinvestment to replace reserves throughout the oil price cycle, will continue to be a challenge, especially at oil prices below $40/bbl. The average dividend yield for the group recently spiked to 12%, which is double the yield at the start of this year and compares with the year end 2014 average of about 5% and a long term historical average of about 4%.
M&A Market Outlook
Poor underlying fundamentals and price volatility continues to dampen the M&A outlook. Deal activity has fallen sharply thus far in 2020. Active divestment programs by most of the global integrateds that were intended to raise cash to help reduce debt and/or trim cash flow deficits are now facing serious headwinds.
After hitting a 20-year low in 2019, global upstream deal count is grinding to a halt so far in 2020. The oil price declines and volatility drive a wider disconnect between buyers and sellers. Thus far, in 2020, January through March, there have been only a dozen deals announced with a combined deal value of about $2 billion. This compares to the monthly average deal value of roughly $10 billion in the past five years.
We also believe that there's still too many companies chasing too few quality opportunities, both in M&A and organic. And, more industry consolidation will further reduce the cost structure and improve portfolio options. In short, capital market conditions are likely to remain unfavorable for some time.
Given the constant changes in the state of the oil markets, these various scenarios and potential outlooks for global integrated oil companies, are in flux.
Read part two and part three of this series for further insights.
Learn about our upstream companies and transactions service.
Lysle Brinker is an executive director of research & analysis at IHS Markit.
Posted 06 April 2020
This article was published by S&P Global Commodity Insights and not by S&P Global Ratings, which is a separately managed division of S&P Global.

