Permian Basin technical issues: (Part 2) How to optimize well spacing
A collaborative article by Justin Pettit, Sr. Advisor Upstream Consulting, Mohammad Tavallali, Sr. Reservoir Engineer and Michael Muirhead, Sr. Geologist
Our last article, Permian Basin Technical Issues (Part 1): How to Manage Water Cut outlined how managing fracture height is an important part of managing water production. Fracture height is a critical process variable to target for process control efforts in order to avoid crossing formations or reservoir benches and better control water production.
In this article, we discuss how tighter control over fracture height can also yield benefits in terms of the optimization of vertical and horizontal well spacing. Similarly, it can also help with stage spacing optimization, but that is beyond the scope of this study. We evaluated optimal well spacing, in terms of estimated ultimate recovery (EUR), given various reservoir and fracture properties in the Wolfcamp Formation.
Analytic Approach
Although development in the Permian Basin has been underway for many decades, unconventional development in the Permian has been a more recent and increasingly significant phenomena, now representing about one-half of all US drilling activity. This highlights the need for a more detailed understanding and clarity of its formations. For example, the Wolfcamp Delaware play exhibits complex reservoir characteristics, with reservoir quality and properties that vary significantly along both horizontal and vertical planes. The Permian Basin's complexity and heterogeneity complicates the optimal number, location and orientation of wellbores and benches, as well as the number, placement and design of the fracture stages. We coupled approach of numerical simulation with experimental design was utilized to determine the effective parameters or combination of parameters on well spacing.
Our approach for estimating optimal well density in the Wolfcamp Delaware from IHS historical well data, built upon the previous work Permian Basin Technical Issues: (Part 1) How to Manage Water Cut with a set of base values for fracture and reservoir properties obtained from a numerically calibrated model. Recall that this workflow began with Data QC (e.g., completion and production data), followed by a Communication Assessment (e.g., pressure and rate transient analysis), and single-well RTA of reservoir and fracture parameters. Our final step in the estimation of optimal well density employed a sensitivity analysis for frac-hit evaluation.
To simulate reservoir and fracture uncertainty, we assumed a relevant range of properties based upon the empirical data; permeability and fracture half-length exhibited the most variation. We employed a two-stage experimental design methodology for the sensitivity analysis using both a One Parameter at a Time (OPAT) and a Full Factorial Analysis of Variance (ANOVA) method. These techniques enabled us to optimize our final list of parameters (and combinations of parameters) that affect optimal well spacing.
One Parameter at a Time (OPAT)
First, we used OPAT to develop a short-list of important process parameters. We generated 30-year forecasts and studied the effect of each reservoir and fracture parameter on EUR. We then compared different results (e.g., see Figure 1) to reduce our total number of key parameters to four: 1) fracture half- length, 2) enhanced fracture region size, 3) matrix permeability and 4) drainage area (i.e., well spacing).
Figure 1 depicts some of these relationships between parameters and EUR, with fracture height kept constant in all scenarios. As one might expect, in many situations our results indicated that more than one parameter, or combination of parameters, contributed to final hydrocarbon recovery.
Figure 1: Parameter Impact on Hydrocarbon EUR
Full Factorial Analysis of Variance (ANOVA)
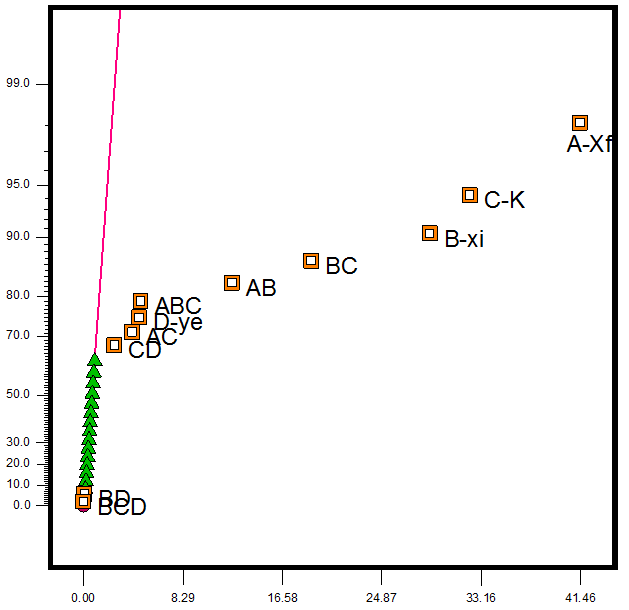
We then used a full factorial ANOVA methodology to explore the effects of changing more than one variable at a time. Instead of plotting individual data points in a Tornado chart, we included all of our estimated effects data on a single normal probability plot (Figure 2). Data that follows a straight line on a normal probability plot indicates a normal distribution, and thus effectively identifies the least impact on EUR, for a given well spacing.
Figure 2: Normal Probability Plot for Key Parameters on Oil EUR

Results
Our final step was to combine the OPAT and Full Factorial ANOVA procedures to evaluate the impact of fracture half-length, enhanced fracture region size, and matrix permeability, on optimal well spacing (i.e., maximum EUR).
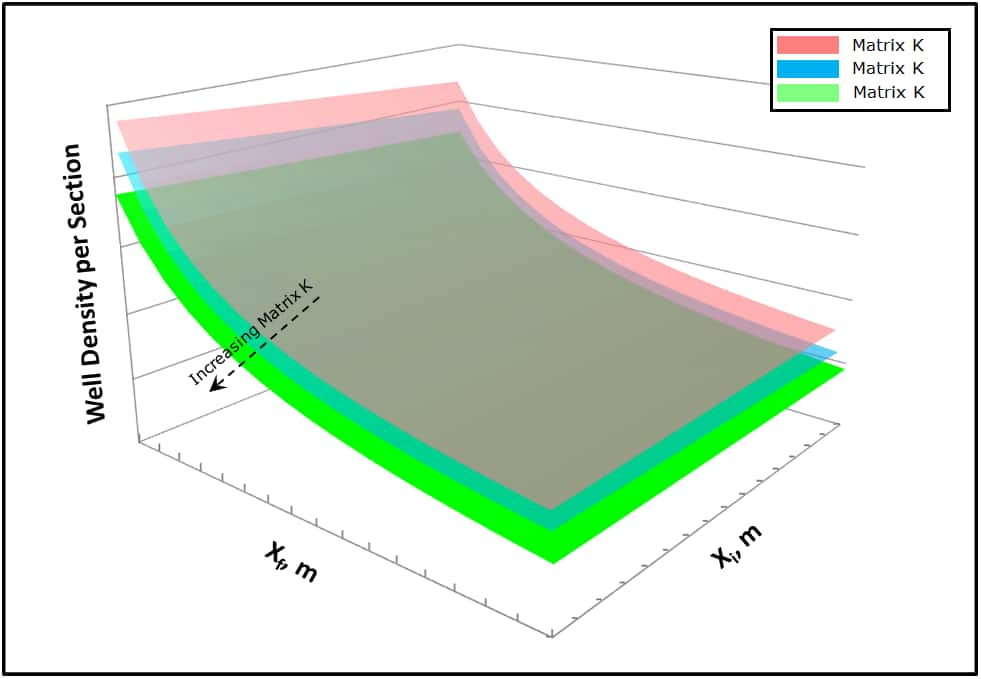
Figure 3: Surface Functions for Well Spacing in the Wolfcamp Delaware Formation

We compiled the results of our sensitivity scenarios to develop surface functions to estimate well spacing as a function of fracture half-length, enhanced fracture region size, and matrix permeability (Figure 3). The vertical axis represents well spacing and the planer axis is fracture half-length and enhanced fracture region size (i.e., stimulated reservoir volume). The plot shows three different layers of matrix permeability. The number of infills for a given EUR is reduced if: 1) matrix permeability increases, or 2) fracture half-length increases, or 3) enhanced fracture region size increases.
Conclusions
Better fracture height control enables the optimization of vertical and horizontal well spacing as well as better water cut management. We evaluated optimal well spacing, in terms of EUR, for reservoir and fracture properties in the Wolfcamp Delaware and developed surface functions to estimate well spacing as a function of fracture half-length, enhanced fracture region size, and matrix permeability. We found that optimal well-spacing is reduced under any combination of increased matrix permeability, fracture half-length, and enhanced fracture region size.
A collaborative article by Justin Pettit, Sr. Advisor Upstream Consulting, Mohammad Tavallali, Sr. Reservoir Engineer and Michael Muirhead, Sr. Geologist
Posted 7 March 2017
This article was published by S&P Global Commodity Insights and not by S&P Global Ratings, which is a separately managed division of S&P Global.


