Petrophysical techniques for unconventional analysis in the Permian Basin
The Wolfcamp Formation within the Permian basin and each of its shale benchmarks provides an excellent example of how we can use petrophysical data to gain insight into where an asset holds its current value, and how much potential it may have for future further development. The Wolfcamp is a very thick formation throughout the Permian, with variable lithology. In order to carry out a detailed Petrophysical analysis, it is better to break thick formations up into smaller zones or benches for more detailed analyses.
Defining Wolfcamp Benches
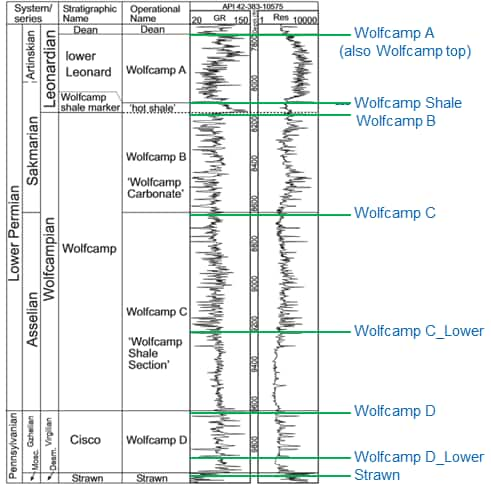
Figure 1: Type log for the Wolfcamp section of the Midland Basin taken from the Clinton Oil #2 O.L. Greer Well. Data from IHS Energy (2016) and Baumgardner, et al (2014)

Figure 2: NW-SE Cross Section through Midland, Reagan and Glasscock Counties with Wolfcamp Benches
By utilizing petrophysical models, log calculations, and cross plotting methods, integrated with available well and log data spanning the Texas counties of Midland, Reagan, and Glasscock, an accurate assessment can be made of the area's key reservoir characteristics and its hydrocarbon potential.
Utilizing a modified Δ Log RTechnique to Identify Organic Shale Potential
Considering a series of assumptions delineated and validated from previous research methods:
- organic-rich sediments have a higher resistivity than organic-lean sediments
- organic-rich rocks decrease in sonic transit time and increase in resistivity
- organic-rich rocks can have a higher gamma-ray reading than ordinary shale and limestone
Keeping these assumptions in mind, the total organic carbon (TOC) of the Wolfcamp shale throughout this area can be isolated by using log calculations and cross plotting techniques focused on a modified Δ log R method that incorporates sonic vs. resistivity data (modified after Passey, 1990).
The Modified Δ Log R Workflow
- Calculate LogR of resistivity Logs
- You can accomplish this utilizing the following calculation: LogR=LN(R)
- Crossplot LogR vs Sonic (DT)
- Determine the low Resistivity Shale Line from Cross Plot
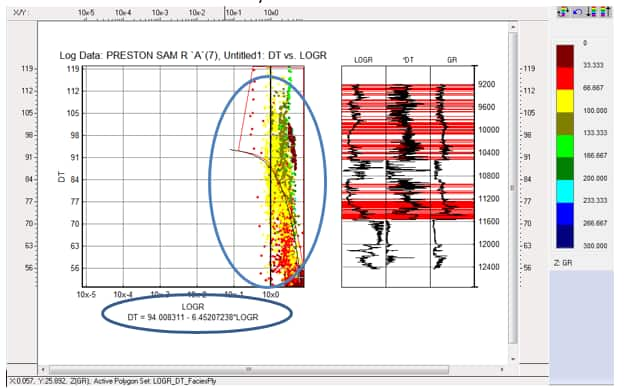
Figure 3: LogR vs Sonic (DT) Crossplot highlighting the low resistivity shale line as well as B and M constants gained from the generated shale line.
- Calculate New Sonic Logs from variables generated from the Low Resistivity Shale Line
- DtR=B-M*LOGR

Figure 4: B and M constants gained from the generated shale line.
- Overlay Pseudo-Sonic DtR over Sonic in X-Section
- Highlight the crossover of Pseudo-Sonic with DT in order to interpret shale in section.
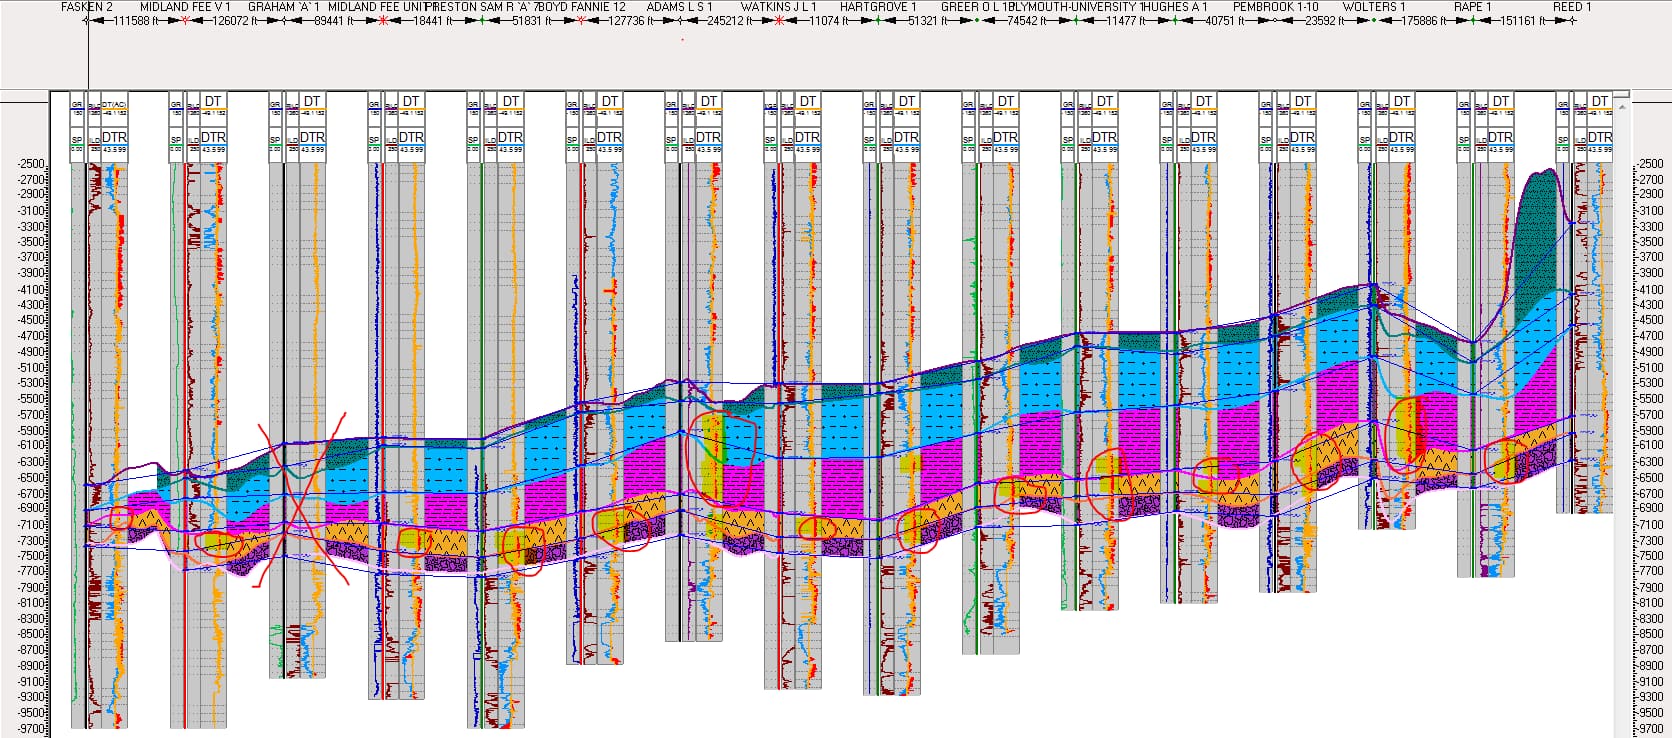
Figure 5: NW-SE Cross Section through Midland, Glasscock, and Reagan counties showing Pseudo-Sonic DtR over Sonic in Track 2. Circled areas in the lower Wolfcamp benches show higher potential for TOC than higher benches in this area
Basic Petrophysical Techniques for Reservoir Characterization
Petrophysical Log Curves for porosity, volume of shale, permeability, and water saturation can then be calculated and generated from available log curve data utilizing the IHS Markit Kingdom application. These additional calculated values will allow for further assessment of potential for the area. These generated log curves are utilized in a zone analysis to calculate the water saturation and porosity for each Wolfcamp bench throughout Midland, Glasscock and Reagan counties.

Figure 6: Well sample locations.
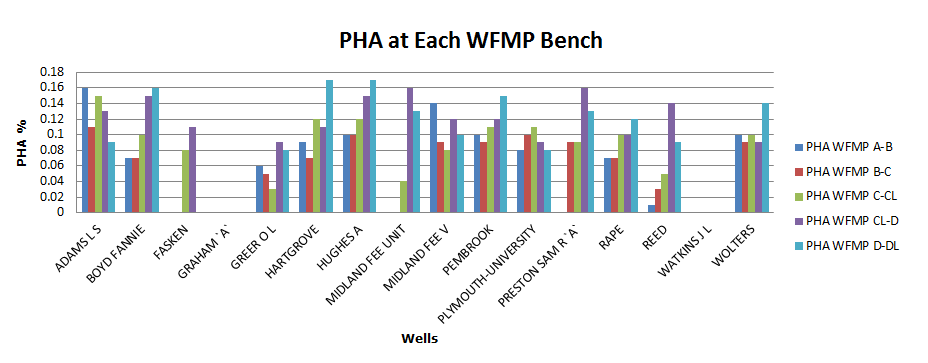
Figure 7: Average Porosity calculated at each WFMP bench.

Figure 8: Average Water Saturation calculated at each WFMP bench.
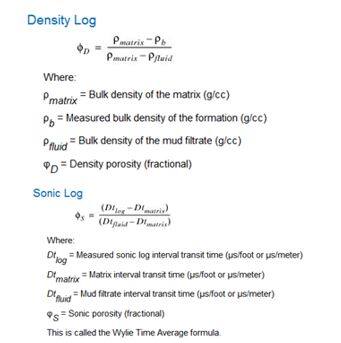
Figure 9: Calculate Porosity from Density and Sonic log curves
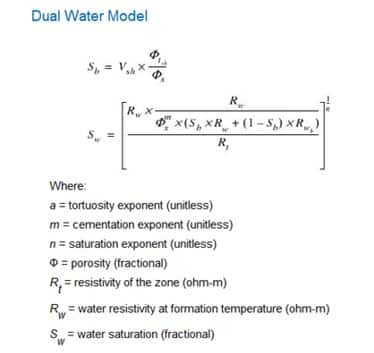
Figure 10: Calculate Water Saturation using a Dual Water Model
Using the modified Δ log R method, the logs for wells in this area indicate that the Wolfcamp shale benches appear to have good TOC, and therefore, are prospective for hydrocarbon production. Attribute maps of generated porosity and water saturation values throughout the area show an increase in porosity with each subsequent Wolfcamp bench and variable water saturation throughout the Wolfcamp zone, displaying fluid distribution trends. Further analysis of petrophysical log curve data incorporated into area Cross Sections clearly highlights potential pay zones.
Rachael Moreland is a Technical Advisor at IHS Markit.
Posted 20 June 2017
This article was published by S&P Global Commodity Insights and not by S&P Global Ratings, which is a separately managed division of S&P Global.


