Subsurface delineation and technology gains have transformed US shale system
The shale gale has transformed the global energy markets, unleashing economic oil and gas resources through horizontal drilling and hydraulic fracturing technologies. US crude oil production has had an unprecedented growth since 2008 as a result of the shale revolution that started with natural gas between 2004 and 2008, and predominantly from oil plays since 2008. In 2018, US entry-to-exit production grew by around 2 MMb/d. It is projected to grow by more than 1.35 MMb/d in 2019 and expected to reach 16 MMb/d by 2025.
Although, the vast US oil and gas recoverable resources would be able to support production growth for at least the next decade, it is vital to understand the key drivers of US oil production growth to estimate the risks to the forecast volumes.
- Subsurface—A commercially viable resource base is a primary factor determining the US supply. Bench delineation in many plays particularly the Permian Basin, but also the STACK and Powder River Basin, has proved sufficient resources for at least the next decade. There were drastic productivity improvements since 2014 as operators started delineating benches, targeted sweet spots, drilled longer laterals, and used higher proppant loads during completion. But as detailed in a series of IHS Markit's reports in late 2018, the rate of improvement has decelerated virtually everywhere and stopped in some locations in 2018. We expect some continued marginal gains before tapering off in 2020.
- Financials—Oil price signals, cost of development, capital availability, and financial discipline sentiment have played a key role in determining US production growth in the past few years. 2019 will be a year of testing commitment to financial discipline, whether operators would be able to trade off growth for returning cash to the shareholders and if the investors would reward this new business model.
- Logistics—Service sector bottlenecks emerged as activity ramped up in early 2018, but the additional capacities added since then are easing the utilization rate and reducing the pricing power of the service sector. We do not anticipate any material constraint in the service sector for the IHS Markit base case forecast. Additionally, as unconventional production increased dramatically, it necessitated huge infrastructure buildout in many regions like the Permian, Eagle Ford, Bakken, and Appalachia; infrastructure is not a hindrance to IHS Markit base case volumes for the forecast period 2019-23.
Impact of subsurface delineation and technological
innovations on US supply
The average peak rate and cumulative oil production of a
US well has materially accelerated since 2014 due to innovative
technologies such as high-intensity well completions, longer
laterals, and delineation of benches across various plays.
Operational changes
Consistently improving subsurface understanding is evident
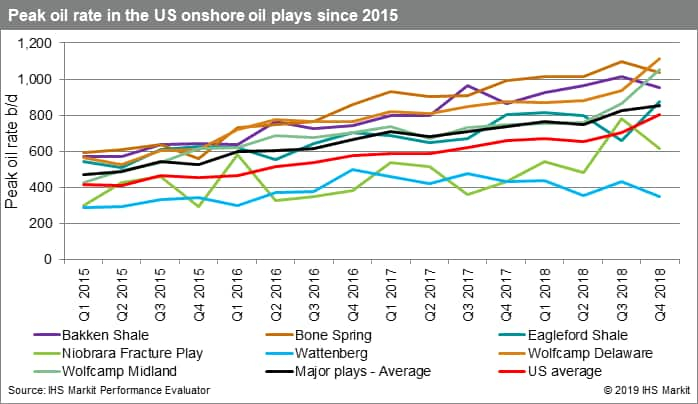
from the well results. The average peak rate of an onshore well
improved steadily from 2015 to 2018 by around 60%. The IHS Markit
base case forecast does assume additional well productivity of 5 to
10% through 2020.
 Figure 1: Average peak oil
rate for the major US plays 2015-18
Delineation improvements
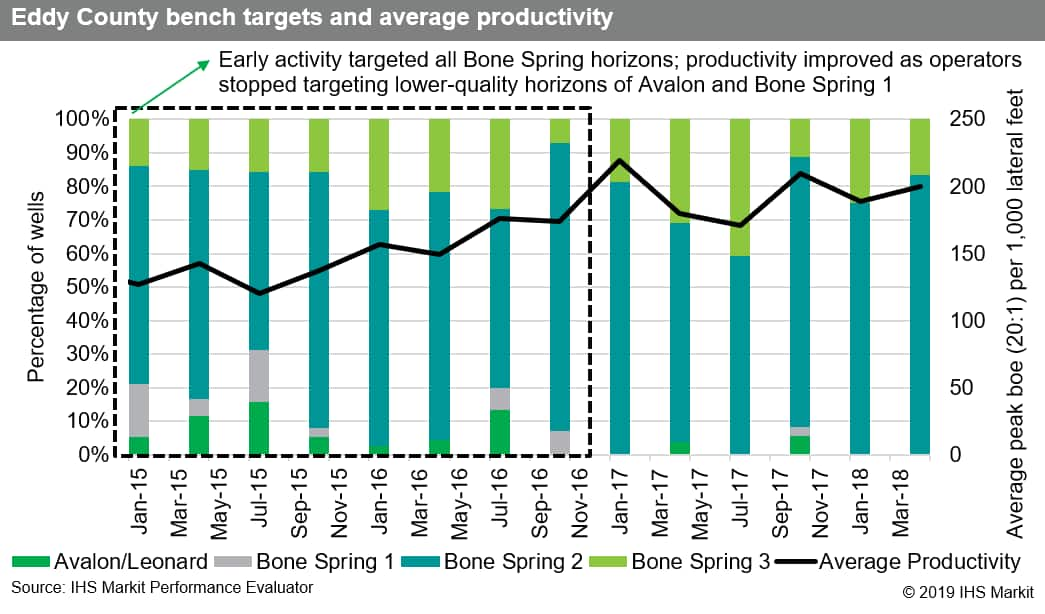
In the Permian's Bone Spring play, the Bone Spring and
Avalon reservoirs are highly heterogeneous and occur at a wide
range of depths across the Delaware Basin. The Bone Spring 2 zone
is the most productive, and it is thickest across the northern
Delaware Basin mainly in the Eddy and Lea counties. Delineation in
Eddy County has led to impressive productive improvements. Major
operators have focused on developing the Bone Spring 2 with wells
having average peak rates of around 200 boe/d per 1,000 lateral ft
(20:1).

Figure 2: Average productivity and bench targets in Eddy County
2015-18
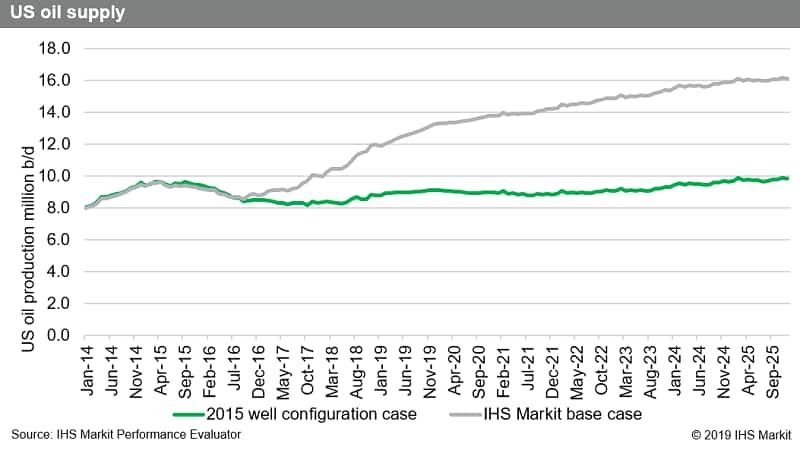
To understand the effect of subsurface delineation and drilling and completion technology innovations, IHS Markit has modeled a scenario by removing all the tangible improvements in well productivity that have happened since 2015. The model started with type curves, lateral lengths, completion techniques, and other well-level metrics from 2015, and then used the actual number of producing wells since 2015, implicitly assuming service sector and infrastructure availability to be the same as that of the IHS Markit base case forecast. The exercise was run to test how well configurations and productivity improvements played a role in the dramatic US production growth since 2015. The results were striking.
- Resetting wells to 2015 well configuration grew average yearly US supply to 8.5 MMb/d (versus 11.0 MMb/d actual) in 2018. Average US onshore well productivity, posting improvements from 2015 to 2018 of around 60%, has thus powered supply growth.
- US supply would have grown to 9.0 MMb/d in 2019 and up to 9.8 MMb/d in 2025 with 2015 well metrics, in contrast to the IHS Markit base case, which shows impressive growth to 12.6 MMb/d in 2019 and up to 16.0 MMb/d in 2025.
- Major oil plays such as Bakken, Eagle Ford, Permian, and Rockies together would grow production from 5.0 MMb/d in 2015 to 6.2 MMb/d by 2025 for the 2015 well-configuration case, while the IHS Markit base-case forecast expects growth up to 11.0 MMb/d by 2025.
 Figure 3: US supply base case
vs. 2015 well configuration case
Subsurface delineation and technology gains in the past few years have revolutionized the US shale industry. Although subsurface productivity is a key factor to understanding the volatility of the US shale market, it was never a constraint to production growth in the past few years. Subsurface risks have been historically mitigated with technological innovation. However, it is important to understand the effect of productivity gains on US supply as the rate of productivity improvements has decelerated in many plays and will taper out during the forecast period 2020 and beyond, requiring higher investments after 2021 to maintain the same level of growth as in 2018 and to offset plateauing or declining peak productivity.
Learn more about our coverage of the US plays and basins.
Narmadha Navaneethan is a Principal Analyst in Plays and Basins at IHS Markit.
Posted 31 May 2019
This article was published by S&P Global Commodity Insights and not by S&P Global Ratings, which is a separately managed division of S&P Global.
