Unveiling Market Dynamics: Insights and Projections from Q4 2023
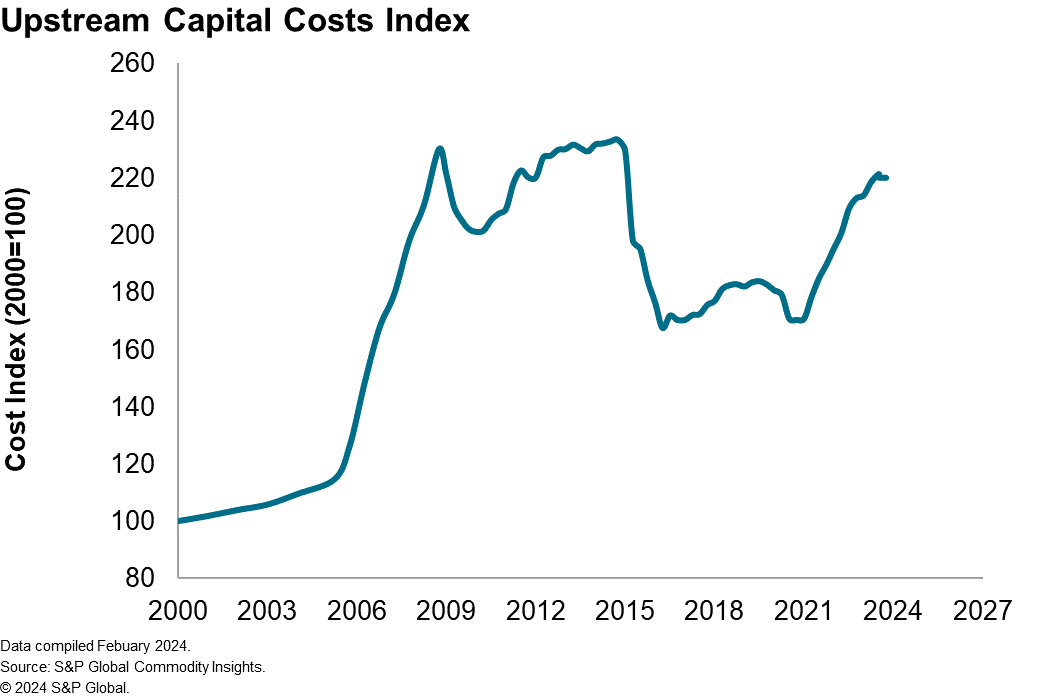
The Upstream Capital Costs Index (UCCI) provides a key indicator for cost inflation affecting the oil and gas sector, which saw a modest decrease in fourth quarter of 2023 the second quarter of decline since the fourth quarter of 2020, that reflects a slight softening in the overall cost environment for upstream projects.
This change comes after a period of sustained growth indicating a potential shift in market dynamics across market segments. We saw steel prices decreased by 1.1% during the fourth quarter 2023 that contributed to an 11% decline year-over-year. This trend is forecasted to continue into 2024, with a projected decrease of 5.5% in steel costs, suggesting a period of market correction after significant price increases over previous years.
Offshore installation vessel costs increased by 3.1%, driven by the recovery in demand for high-spec vessels that command higher day rates. This underscores the markets favoring high spec vessels despite an oversupply of older and smaller boats. Offshore rigs decreased by 1.2% in fourth quarter 2023 and expected to increase by 7.3% in 2024 linked to the anticipated acceleration of new projects as the sector continues to recovery.
Equipment costs saw a slight increase of 0.5% that can be attributed to elevated levels of demand and a shift towards standardization and efficiency. The relative stability in equipment costs indicates suppliers have been carefully balancing their order books to maintain profitability and manufacturers strategically navigating challenges caused by currency fluctuations, geopolitical tensions, and supply chain dynamics on cost structures and by seeking alternative suppliers and vertically integrating their processes to ensure cost stability and manage lead times effectively.
In summary, the latest UCCI figures from Q4 2023 present a nuanced picture of upstream capital expenditure, with some segments showing resilience and others adjusting to market pressures. The downward adjustment in steel prices juxtaposed with the rise in offshore installation vessel costs exemplifies the sector's interplay of supply, demand, and broader economic factors.

Trends and Shifts in Upstream Operating Costs
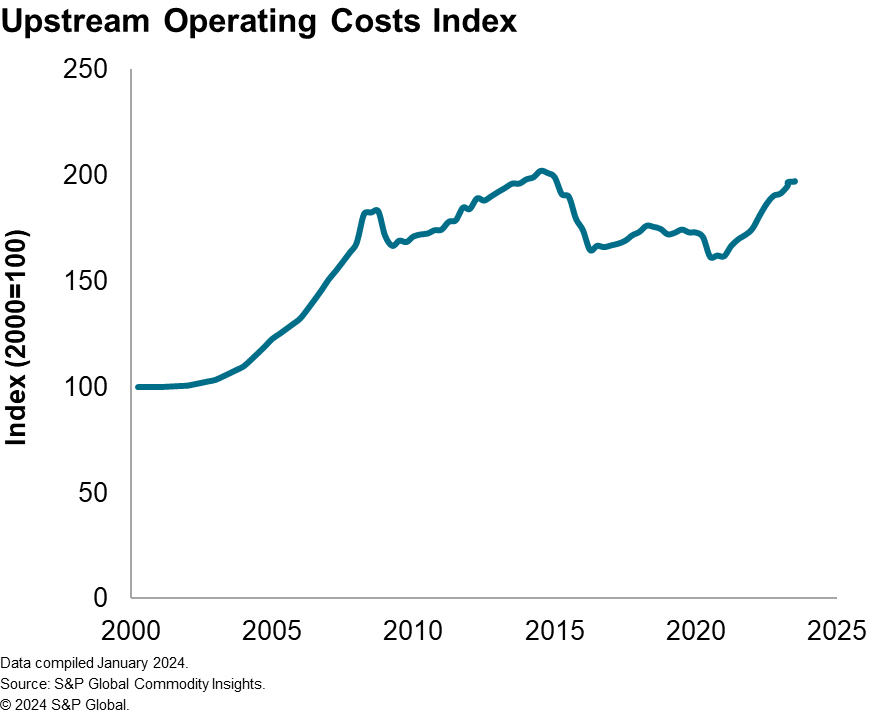
The Global Upstream Operating Costs Index (UOCI) saw a marginal growth of 0.1%, indicating a near-stagnant cost environment as the year concluded. This period of relative stability in operating costs comes after a volatile economic backdrop, with the UOCI growing 1% in local currency terms. This growth is tempered by the appreciation of the US dollar against other major currencies, which has a significant impact on the cost structures of global operations.
In the offshore sector, the overall index's growth was even more subdued at just 0.04%, while the onshore index saw a slightly higher increase of 0.3%, to suggest that the industry may be experiencing a plateau in overall cost escalation, possibly because of strategic adjustments within the sector. Looking at individual market analyses provides a granular view of the factors influencing these costs. The diesel index grew by 2%, influenced by low inventories, high refining margins, and ongoing global disputes. This growth occurred despite a 3% fall in Brent prices, which averaged $84.3/b over this period. The Vessel indexes have been more erratic, with significant variation across regions and vessel types. The Global DSV/ROVSV index grew by just 2% while the same index for Latin America climbed by 11%. Even the usually sticky PSV index grew by 4%, with spikes of 10% and 20% in Africa and the Middle East, respectively. High spec vessels are particularly sought after and escalations for the most highly prized vessels have been far greater.
Labor costs present a contrasting picture. While the labor index fell by 0.4% due to the strong US dollar, wage growth was positive in local currency terms across all the countries tracked by the service. This highlights the localized nature of labor markets and the varying impact of currency movements. The maintenance index, which includes facilities inspection and maintenance, marine maintenance, and other related activities, saw a modest increase of 0.3% in the fourth quarter. This growth is indicative of the ongoing investment in maintaining operational integrity and efficiency in the face of a challenging economic environment.

Downstream cost inflation slowdown driven by steel and bulk material markets
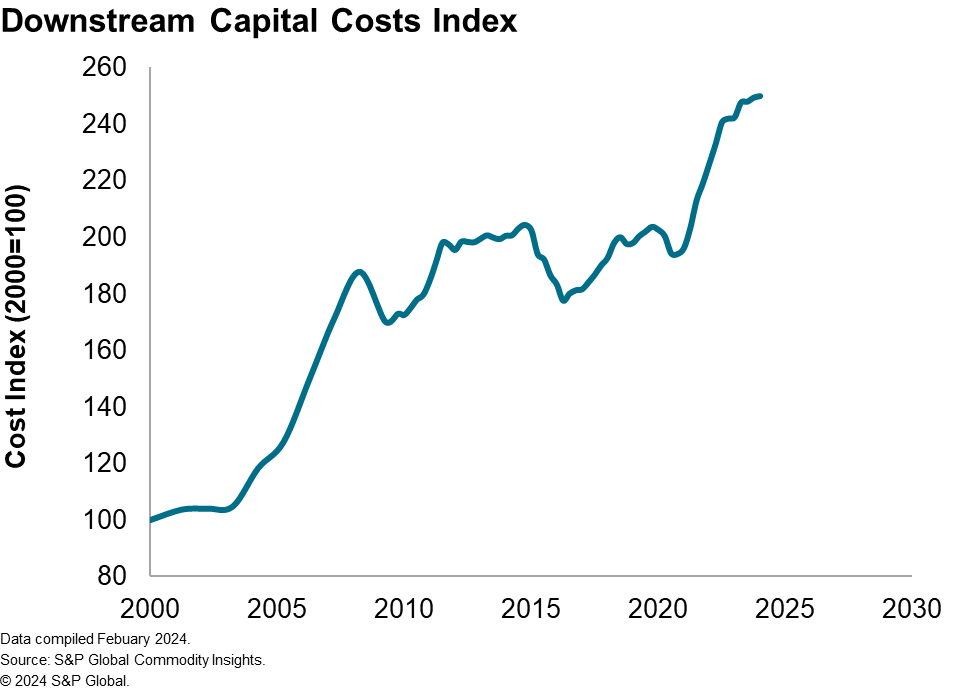
The Downstream Capital Costs Index (DCCI) tracks the movement in capital investments in refining and petrochemical facilities and registered a modest increase of 0.2% in fourth quarter 2023. Steel costs saw a decrease of 2.3%, continuing their descent in North America and Europe, while Asia's steel prices found a floor amid cost pressures. The drop in oil prices during the quarter contributed to lower costs for oil-derived materials, with asphalt, insulation, and paint segments experiencing notable price reductions.
Conversely, construction labor costs edged up by 0.7%, reflecting the impact of currency depreciation across Europe, Asia, and Canada. The local currency index offers a more nuanced view of wage movements, as labor markets remain tight, and the hunt for skilled employees persists.
The DCCI market movements and index performance saw the refining index increase up by 0.2%, culminating in a 3.0% rise for the year. The petrochemical index also grew by 0.4% in the fourth quarter, pushing its annual growth to 3.5%. These indices capture the sector's resilience and adaptability in the face of shifting economic landscapes.
Construction labor and Engineering and Project Management (EPM) rates have been particularly influential, with their significant weight in project costs. Between 2021 and 2023, these rates were buoyed by continuous hiring amid tight labor markets, despite a wobble in global economic growth. Wage inflation has remained steadfast, driven by a shortage of skilled labor and robust demand for refined products.

As industry stakeholders look towards 2024 and beyond, S&P Global Commodity Insights Costs Supply & Chain Services provides a comprehensive understanding of the cost environment and strategic guidance on navigating market currents. In-depth market analyses provide forward-looking insights across key segments reflecting the ongoing interactions between economic, geopolitical, and sector-specific drivers. An index workbook provides detailed analyses and projections by cost components and their trajectories to provide a robust foundation for informed decision-making.
This blog is an extract from the Upstream Capital Cost Index, Upstream Operating Cost Index and Downstream Capital Cost Index market reports that are available to subscribers on our Connect platform. A summary of the Cost and Supply Chain Indexes can be found on the Costs and Supply Chain capability pages on the S&P Global website.
For further inquiries and to harness the power of informed decision-making, contact us at ci.support@spglobal.com.
This article was published by S&P Global Commodity Insights and not by S&P Global Ratings, which is a separately managed division of S&P Global.


