US natural gas: A safe bet on supply?
Key implications
The US natural gas storage inventory deficit that developed last winter has not abated: strong demand from the electric power sector-driven by coal plant retirements and supportive weather-coupled with stronger LNG exports has eaten into the largest production growth in history. The market now faces the prospect of an end-of-season storage balance of 3,400 Bcf-400 Bcf below the five-year average and the lowest end-October level since 2008. Such a low inventory heading into the winter could spell disaster: if the winter is like the 2013/14 winter, when 3,000 Bcf was withdrawn from storage, then the market will exit March 2019 at 400 Bcf. Yet, Henry Hub prices remain subdued and have been rangebound between approximately $2.70/MMBtu and $3.00/MMBtu this summer. These prices are in stark contrast to the price run-ups that are normally associated with such deficits, suggesting an apparent lack of concern from market participants. What gives?
- The market is expecting near-term production growth, driven primarily by new pipeline capacity out of Appalachia, in addition to strong associated gas growth.
- Eastern consuming markets are gaining greater access to low-cost, more closely located supplies, thanks to the massive Appalachian pipeline build-out over the past several years.
- IHS Markit expects an end-October inventory of 3.4 Tcf, assuming prevailing prices and production growth from Appalachia as new pipelines enter service. This inventory level suggests an end-of-winter range between 400 Bcf and 1,900 Bcf, with an expected 1,600 Bcf exit based on normal weather.
No price run up .. yet
The US natural gas market is entrenched in a deep storage deficit, with virtually no hope of returning inventories to the five-year average before the start of the winter. Yet, market participants and therefore prices appear nonplussed.
Typically, for summers when the market has exited the prior winter with above-average storage inventories, gas prices drop to incentivize power sector gas burns and bring end-of-summer inventories back to about average ahead of the following winter. Conversely, during summers when the market exited the prior winter with below-average storage balances, gas prices rise to shift power generation to coal and bring end-October levels toward average ahead of the following winter.
This summer, the market has been experiencing a much different dynamic. * See the IHS Markit Insight: Natural Gas Storage Levels Match 4 Years Ago, But Market Differences Are Vast. The US Lower 48 exited winter 2017/18 with an end-March inventory deficit of 336 Bcf (compared with the five-year average). This deficit grew quickly to 500 Bcf during the freezing April, as supply growth enabled the market to tolerate storage withdrawals through the first three weeks of April at prices below $2.80/MMBtu. The deficit has persisted, as supply growth has served record power sector loads (owing to hot weather and coal plant retirements), and, as a result, storage balances are now on a path to end the summer at well under 3,500 Bcf-the lowest level since 2008. Despite this looming start-of-winter deficit, Henry Hub daily average cash prices this summer have remained below $3.00/MMBtu on all but a few days.
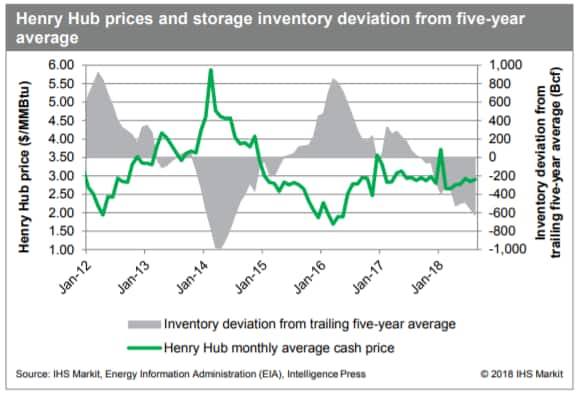
Figure 1 depicts Henry Hub monthly average cash prices, compared with the deviation of storage inventories from the five-year trailing average. Historically, prices have dropped with inventory surpluses and risen with inventory deficits. Seemingly, this relationship has broken down since early 2017 (except for a brief price spike in early 2018), and gas prices have not increased in response to the growing deficit of storage balances to historical norms.

Figure 1: Henry Hub prices and storage inventory deviation from five-year average.
What gives?
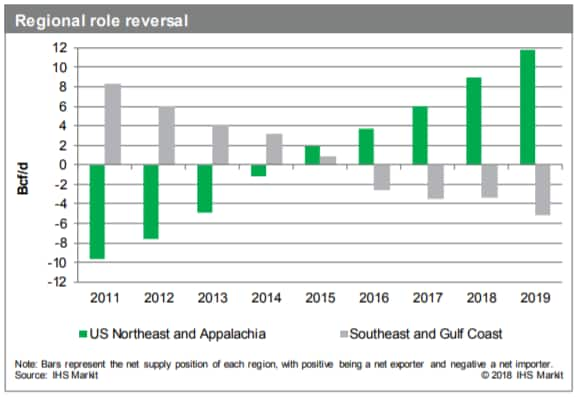
Probably the most significant factor influencing the current storage-price relationship is the enormous increase in production since last summer. In June 2017, US gas production began the largest growth period in history, and, by the end of August 2018, production is expected to be up more than 10 Bcf/d compared with May 2017. More than half of this increase is in Appalachia, home to the prolific Marcellus and Utica plays and close to northeastern residential and commercial demand markets that historically have depended most heavily on storage to meet winter needs. Indeed, the effect of the Shale Gale has been unprecedented-in 2011, natural gas demand in Appalachia and the US Northeast exceeded local supply by an estimated 9.7 Bcf/d; by 2015, the two regions swung to a net oversupply of 2.0 Bcf/d; and, for 2018, we expect a net oversupply of 8.9 Bcf/d (see Figure 2).* [FTN: Based on the IHS Markit regional classifications, Appalachia is defined here as Delaware; Washington, DC; Kentucky; Maryland; Ohio; Pennsylvania; Virginia; and West Virginia. The US Northeast is defined here as Connecticut, Maine, Massachusetts, New Hampshire, New Jersey, New York, Rhode Island, and Vermont.] Pipeline build-out in Appalachia has arguably allowed the region's local and surrounding markets to rely increasingly on pipeline deliveries to satisfy peak winter loads, thereby reducing the need to rely on storage withdrawals.

Figure 2: Regional role reversal.
Production has grown, but so has demand-and not all in the same place. While Appalachia is now a net regional gas exporter, the Gulf Coast and Southeast regions are key demand growth markets (driven by the power and export sectors). The Gulf Coast has traditionally been and will remain a net regional gas supplier, thanks to growing production from onshore plays (as Gulf of Mexico offshore production has declined). By contrast, the Southeast is a net demand center, with demand expected to exceed local supply by more than 12 Bcf/d in 2018, up from about 9 Bcf/d in 2011. However, the strong economics of Appalachia's gas resource has driven ongoing pipeline build-out (and reversal of existing lines) to deliver that gas to the growing Southeast market, reducing the Southeast's dependence on traditional Gulf Coast supply and restraining prices.
Sitting DUCs to the rescue?
In addition to the unprecedented dry gas production growth from Appalachia in recent years, the oil price upturn since late 2017 is driving stronger growth in associated gas production (primarily from the Permian Basin). This supply can be sustained at very low-and even negative-natural gas prices, given the returns on the liquids components.
Furthermore, the growing backlog of drilled-but-uncompleted wells (DUCs) may be another factor keeping a lid on natural gas prices. When the DUC backlog is high (or growing rapidly), the market can be confident that supply can be ramped up quickly. Data from the EIA show that DUCs in the US Lower 48 increased more than 40% from January 2017 to June 2018. At the end of June, DUCs were 7,943-the highest since EIA began tracking them in January 2014 and up from 5,501 in January 2017. If DUCs are acting as a readily available safety net for supply, they have possibly lessened the immediate need to refill storage.
Finally, beyond this winter, next year's expected supply growth could push storage inventories back to historical record highs by end-October 2019, potentially shortening the telescope to a view of simply getting through this winter.
How will the market play out?
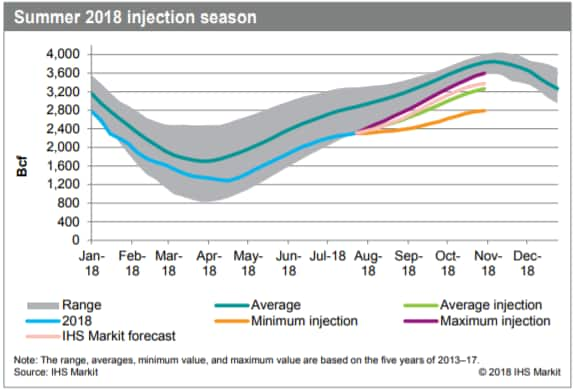
Given prevailing market prices and Appalachian production growth, as new pipelines enter service this fall, IHS Markit expects the end-October inventory to reach 3,400 Bcf (see Figure 3). Even if injections from now until the end of October were at the highest levels of the past five years, US end-October inventories would barely break into the five-year range. There is little doubt that the market will begin this winter with well below-average inventory levels.

Figure 3: Summer 2018 injection season.
So, what does this mean for winter 2018/19? Storage withdrawals for the past five winters have averaged 2,200 Bcf, ranging between a low of 1,500 Bcf (during the relatively mild 2015/16 winter) and a high of 3,000 Bcf (during the polar vortexes of the 2013/14 winter). Assuming a 3,400 Bcf end-October storage inventory for 2018, these ranges would put end-March 2019 storage inventories at between 400 Bcf and 1,900 Bcf, with an average withdrawal producing an end-March balance of 1,200 Bcf (see Figure 4). We expect growing production to reduce the call on storage by roughly 400 Bcf, and-under normal weather-the market to exit March 2019 with a storage balance of approximately 1,600 Bcf.

Figure 4: Winter 2018/19 withdrawal season.
End-March storage inventories for the past five years have averaged 1,600 Bcf, moving in a range of 800 Bcf to 2,500 Bcf. Although we expect the market to exit winter at the five-year average inventory, this forecast is not without risk given that production growth is not guaranteed. Ultimately, the market is facing the prospect of entering this winter with a far below-average storage inventory, and market participants must decide if they are comfortable managing the risk of a cold winter.
Storage players are many and different, and each has its own assessment and tolerance of risks. For example, utilities operating under regulatory must-supply commitments will replenish inventories ahead of the winter to ensure peak-day deliveries through at least mid-February. Other storage players without such commitments may have greater flexibility in how and when to use their capacity and may have more risk tolerance for potential winter price spikes and/or physical supply disruptions (caused, for example, by cold weather or pipeline outages). At least for now, based on current natural gas prices, the market appears unwilling to save more gas into storage and bring the deficit down, betting on more supply through the fall and winter-assuming delayed pipeline projects are brought onstream and ramp up-to accomplish inventory replenishment as well as serve whatever weather turns up in August and early this winter. This may well be rational behavior in the absence of a weather crystal ball, and it is a gamble the market is willing to take.
Learn more about our global gas research and analysis.
Anusha de Silva, Associate Director, IHS Markit, focuses on fundamentals analysis for the North American natural gas market.
Matthew Palmer, Senior Director, IHS Markit, is an authority on North American natural gas markets with upstream oil and gas and financial risk management experience.
Charles Nevle is a Data Analytics Director at IHS Markit.
Posted 16 August 2018
This article was published by S&P Global Commodity Insights and not by S&P Global Ratings, which is a separately managed division of S&P Global.

