Customer Logins
Obtain the data you need to make the most informed decisions by accessing our extensive portfolio of information, analytics, and expertise. Sign in to the product or service center of your choice.
Customer Logins
ECONOMICS COMMENTARY
Jan 28, 2014
New UK indicators to help understand the underlying economic environment
Markit Economics has developed two new economic indicators to provide further understanding of the changing economic environment facing businesses and households in the UK. These new indicators will also provide useful new analytical tools to help monitor and forecast macroeconomic trends.
Business surveys such as the PMI provide a more accurate and timely indicator of what’s happening in the world’s major economies in terms of output, demand, employment and prices than has ever before been available. The next step is to develop indicators that help explain the causes and drivers of the changes in economic variables.
The need for such indicators reflects the failure of traditional economic models to anticipate the 2008-09 financial crisis, the scale of its immediate economic impact and the slow nature of the recovery from the ensuing recession.
By understanding the causes of a turning point in the economic cycle, policymakers can better manage financial conditions to avoid a slump or boom. Investors will also be better placed to anticipate the likely impact on markets and corporate performance, and businesses will have more clarity on future demand.
The theory is straightforward: if, for example, a downturn in GDP is not accompanied by a tightening of financial conditions or heightened economic uncertainty, the downturn is likely to be short-lived (in the absence of other factors) or it is perhaps a signal that the GDP data may later get revised. Conversely, if GDP is rising but uncertainty has intensified and financial conditions have tightened, the upturn is likely to wane.
Not surprisingly, therefore, the new indicators show a close correlation with future GDP trends.
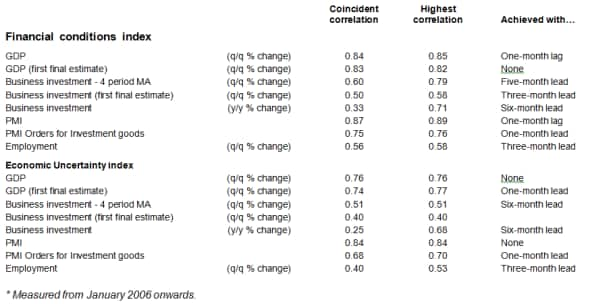
The indicators also act as leading signals of business investment for the same reason, as well as employment (see table). Their use as factors in investment models is also something that is being investigated. We have commenced with two survey indicators for the UK: the Markit Economic Uncertainty Index and the Markit Financial Conditions Index. These will be followed by comparable indicators for other major economies.
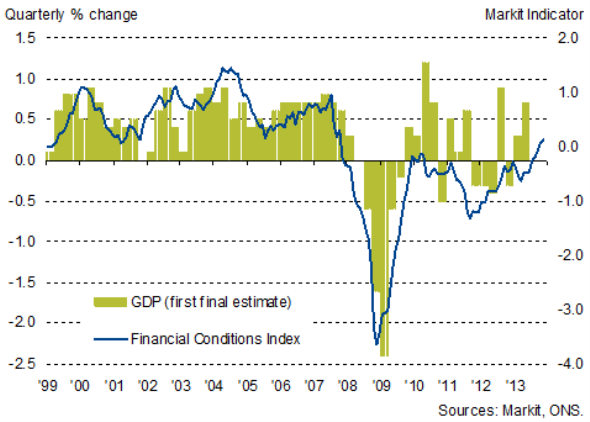
Financial conditions index v GDP

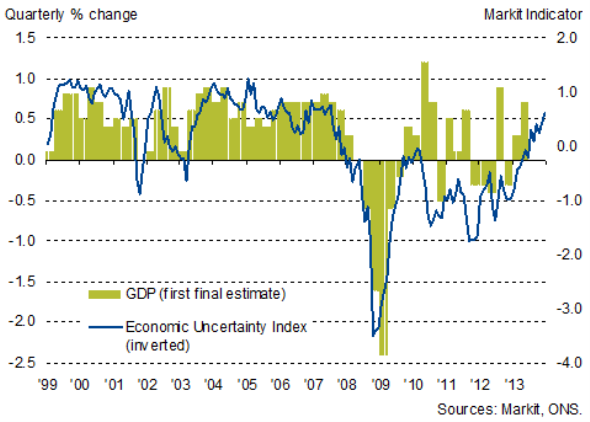
Economic uncertainty index (inverted) v GDP

Track record
Looking at how the indicators changed ahead of turns in the real economy, the Financial Conditions Index (FCI) and Economic Uncertainty Index (EUI) both fell into negative territory in November 2007, a time when the initial estimates of GDP were still showing strong growth (the first estimate of GDP showed a 0.6% rise in the fourth quarter of 2007). It was not until April 2008 that the PMI fell into negative (sub-50) territory, and not until the third quarter of 2008 that GDP started falling.
In the second quarter of 2010, the EUI started to fall sharply as worries mounted regarding the impact of austerity after the general election, and concerns spread about the deepening eurozone crisis. Financial conditions were already still in negative territory. By the end of the year, GDP was falling again.
The indices also illustrated how economic uncertainty also started to rise sharply in the summer of 2011, and financial conditions tightened around the same time, both largely in response to the worsening eurozone crisis. Central banks soon stepped up their stimulus but a further period of economic decline was not avoided, with GDP falling by the end of year.
Both the FCI and EUI show how uncertainty and financial conditions were generally both drags on the economic recovery prior to the middle of 2013. More recently, however, both have risen to levels that are more supportive of growth. In December 2013, the FCI rose to its highest since October 2007, while the EUI reached its highest (meaning uncertainty was at its lowest) since July 2007.
Measuring Economic Uncertainty
Economic uncertainty is a key driver of investment decisions, whether these relate to companies investing in new capacity, households buying property or investors choosing between safe havens and riskier assets.
Components of the uncertainty indicator therefore include variables that measure concerns about job security, indicators of financial market volatility and risk premia. We also look at the spread of economic forecasts (a wide range of forecasts suggest a large degree of doubt exists) as well as web data and media searches relating to terms such as “recession”.
Measuring Financial Conditions
The primary function of the second index is to provide a well-rounded overall view of financial conditions. Its signals should capture the majority of the interactions between the financial sector and the real economy.
We therefore use a variety of components that aim to capture changes in financial conditions and move away from the traditional interest/exchange rate combinations that tended to dominate macroeconomic model building pre-financial crisis. While interest rates and the exchange rate remain important components, coverage is also broadened out to include measures of the supply of credit and changes in asset prices, including corporate debt, property and commodities. An example is the inclusion of data concerning changes in the supply of lending to households and (non-financial) companies. The rationale is that an increase (decrease) in lending is indicative of looser (tighter) financial conditions.
Similarly, strong movements in interest rate spreads can be associated with changes in risk premiums (or credit risk) and financial conditions. We measure such impacts via a measure of the difference between ‘safe’ treasury bills and LIBOR, the lending rate to commercial banks.
Volatility in financial markets is meanwhile captured by the inclusion of a UK equity volatility measure (the VIX).
Methodology
For both of our indices, we use principal components analysis (PCA). This technique essentially extracts components (or factors) that can help explain patterns of correlations within a given dataset.
The resulting combination of these artificially produced factors (r) provides a clearer signal of what the fundamental drivers are of a data set containing a potentially large (and what may seem disparate) number of variables (N). In essence it is a variable reduction exercise, that is r
To extract the principal components, all of the individual series that we use in the dataset have been normalised (i.e. de-meaned and divided by their standard deviations). This ensures that measurement units and/or magnitudes of these variables don’t have any undue influence. As most of the data are expressed in growth rates or are flow variables, we don’t concern ourselves with issues related to stationarity.
Correlations with economic data*

Correlations of the indicators against economic variables such as GDP, business investment, the PMI business survey data and employment are shown in the above table.
The FCI shows an 85% correlation against quarterly growth of GDP. The indicator also has an 89% correlation with the PMI, achieved with the index lagged by one month against the PMI. The indicator also has a 71% correlation against business investment, with the FCI leading the annual rate of growth by six months.
The EUI exhibits a 76% correlation against quarterly growth of GDP, an 84% correlation with the PMI (achieved with no leads or lags applied) and has a 68% correlation with the annual rate of change of business investment, with the EUI leading investment by six months.
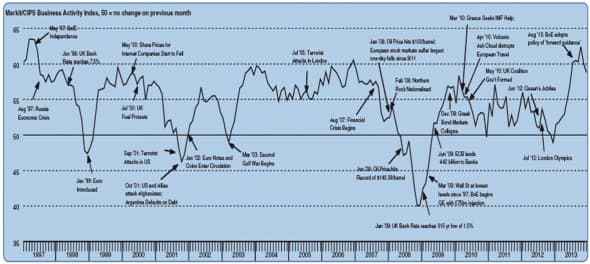
How key events have affected the indicators

{"items" : [
{"name":"share","enabled":true,"desc":"<strong>Share</strong>","mobdesc":"Share","options":[ {"name":"facebook","url":"https://www.facebook.com/sharer.php?u=http%3a%2f%2fstage.www.spglobal.com%2fmarketintelligence%2fen%2fmi%2fresearch-analysis%2f28012014-economics-new-uk-indicators-to-help-understand-the-underlying-economic-environment.html","enabled":true},{"name":"twitter","url":"https://twitter.com/intent/tweet?url=http%3a%2f%2fstage.www.spglobal.com%2fmarketintelligence%2fen%2fmi%2fresearch-analysis%2f28012014-economics-new-uk-indicators-to-help-understand-the-underlying-economic-environment.html&text=New+UK+indicators+to+help+understand+the+underlying+economic+environment","enabled":true},{"name":"linkedin","url":"https://www.linkedin.com/sharing/share-offsite/?url=http%3a%2f%2fstage.www.spglobal.com%2fmarketintelligence%2fen%2fmi%2fresearch-analysis%2f28012014-economics-new-uk-indicators-to-help-understand-the-underlying-economic-environment.html","enabled":true},{"name":"email","url":"?subject=New UK indicators to help understand the underlying economic environment&body=http%3a%2f%2fstage.www.spglobal.com%2fmarketintelligence%2fen%2fmi%2fresearch-analysis%2f28012014-economics-new-uk-indicators-to-help-understand-the-underlying-economic-environment.html","enabled":true},{"name":"whatsapp","url":"https://api.whatsapp.com/send?text=New+UK+indicators+to+help+understand+the+underlying+economic+environment http%3a%2f%2fstage.www.spglobal.com%2fmarketintelligence%2fen%2fmi%2fresearch-analysis%2f28012014-economics-new-uk-indicators-to-help-understand-the-underlying-economic-environment.html","enabled":true}]}, {"name":"rtt","enabled":true,"mobdesc":"Top"}
]}


