Customer Logins
Obtain the data you need to make the most informed decisions by accessing our extensive portfolio of information, analytics, and expertise. Sign in to the product or service center of your choice.
Customer Logins
ECONOMICS COMMENTARY
Jul 30, 2015
A simple guide to nowcasting Taiwan's GDP using the PMI
PMI data can be used to provide a simple but surprisingly accurate guide to Taiwan's GDP growth rate well in advance of official statistics.
The Nikkei Manufacturing PMI", compiled by Markit since 2004, provides an early indication of the health of the economy. It is published on the first day of the month with data relating to business conditions in the month just passed. As such, it is the first economic indicator available each month.
With the industrial sector accounting for around one-third of all economic activity in Taiwan, and over one-in-three jobs, the manufacturing PMI acts as an accurate barometer of the health of the wider economy.
A key advantage of the PMI is that it is also available monthly whereas GDP data are only issued on a quarterly basis.
Comparisons of historical data in fact show that the headline PMI - which is a composite indicator based on individual survey measures of output, new orders, employment, supplier capacity constraints and inventories - exhibits its highest correlation (78%) when acting with a lead of three months against official published annual GDP growth rates.
The high correlation can be used as the basis of PMI-implied GDP growth rates. Our model uses a simple OLS regression where quarterly averages of the PMI are used as the single explanatory variable to approximate the annual rate of GDP growth.
Although the regression yields an adjusted r-square of 0.61, the model clearly produces an accurate advance guide to GDP growth such that:
Annual % change in GDP = (PMI x 0.627) - 29
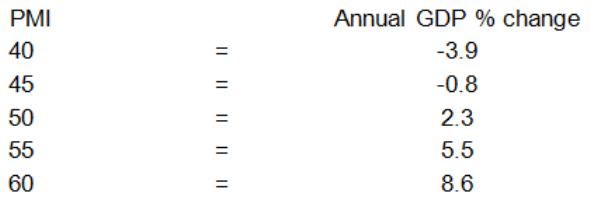
The regression analysis translates into the following implied GDP growth rates:

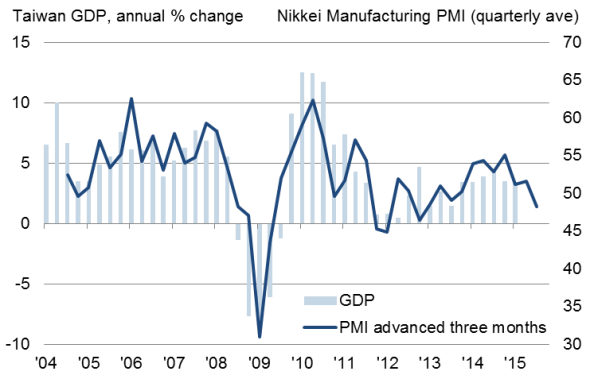
The following chart uses axes scaled according to the regression results:
Taiwan GDP and the PMI

An index reading of 46.2 is in fact comparable with no change in GDP compared to a year ago, with each index point above (below) roughly equivalent to 0.6% growth (decline).
At 51.6, the average reading for the first quarter of 2015, for example, equates to 3.4% GDP growth. The second quarter reading of 48.3 is meanwhile indicative of just 1.3% growth.
{"items" : [
{"name":"share","enabled":true,"desc":"<strong>Share</strong>","mobdesc":"Share","options":[ {"name":"facebook","url":"https://www.facebook.com/sharer.php?u=http%3a%2f%2fstage.www.spglobal.com%2fmarketintelligence%2fen%2fmi%2fresearch-analysis%2f30072015-Economics-A-simple-guide-to-nowcasting-Taiwan-s-GDP-using-the-PMI.html","enabled":true},{"name":"twitter","url":"https://twitter.com/intent/tweet?url=http%3a%2f%2fstage.www.spglobal.com%2fmarketintelligence%2fen%2fmi%2fresearch-analysis%2f30072015-Economics-A-simple-guide-to-nowcasting-Taiwan-s-GDP-using-the-PMI.html&text=A+simple+guide+to+nowcasting+Taiwan%27s+GDP+using+the+PMI","enabled":true},{"name":"linkedin","url":"https://www.linkedin.com/sharing/share-offsite/?url=http%3a%2f%2fstage.www.spglobal.com%2fmarketintelligence%2fen%2fmi%2fresearch-analysis%2f30072015-Economics-A-simple-guide-to-nowcasting-Taiwan-s-GDP-using-the-PMI.html","enabled":true},{"name":"email","url":"?subject=A simple guide to nowcasting Taiwan's GDP using the PMI&body=http%3a%2f%2fstage.www.spglobal.com%2fmarketintelligence%2fen%2fmi%2fresearch-analysis%2f30072015-Economics-A-simple-guide-to-nowcasting-Taiwan-s-GDP-using-the-PMI.html","enabled":true},{"name":"whatsapp","url":"https://api.whatsapp.com/send?text=A+simple+guide+to+nowcasting+Taiwan%27s+GDP+using+the+PMI http%3a%2f%2fstage.www.spglobal.com%2fmarketintelligence%2fen%2fmi%2fresearch-analysis%2f30072015-Economics-A-simple-guide-to-nowcasting-Taiwan-s-GDP-using-the-PMI.html","enabled":true}]}, {"name":"rtt","enabled":true,"mobdesc":"Top"}
]}


