Customer Logins
Obtain the data you need to make the most informed decisions by accessing our extensive portfolio of information, analytics, and expertise. Sign in to the product or service center of your choice.
Customer Logins
ARTICLES & REPORTS
Mar 27, 2023
A Framework for Buy-side Risk Managers: Constructing Inflationary Stress Tests
By Ryo Takei
In 2022, amidst a global pandemic and geo-political tensions, major economies around the world experienced elevated levels in inflation not seen in over four decades. This was coupled by potential slowdown in global economic growth[i]; consequently, the decisions on interest rate policy of major central banks, especially the US Federal Reserve, has become a major driver of price moves in nearly every asset class, from stocks and bonds to real estate and digital assets.
These global macro events have meant that stress testing has become a more important tool for risk teams who are seeking to add more value to front office teams and become more embedded in the investment process at Asset Management firms. However, a challenge for risk managers is to synthesize past events to forecast how the current macro situation could affect their portfolio. Macro events such as inflationary waves occur sporadically and can last for over a decade. Furthermore, in many cases, historical data of portfolio specific risk factors does not exist for dates beyond a few decades ago. This means that constructing relevant stress tests can be challenging.
A two-step framework
To this end, we propose a two-step framework to define stress scenarios:

In step 1, a bespoke analysis of the historical data with an understanding of the environment at the time is applied to generate the realized stress scenarios of major risk factors, such as the stock and bond indices from the historical period(s)
Then, in step 2, the generated stress scenarios of the major historical risk factors are used to infer portfolio specific risk factors based on the correlation over a more recent historical window.
In this article, we seek an answer to step 1: how could one construct a stress scenario of risk factors in today's inflationary environment?
Start with the past
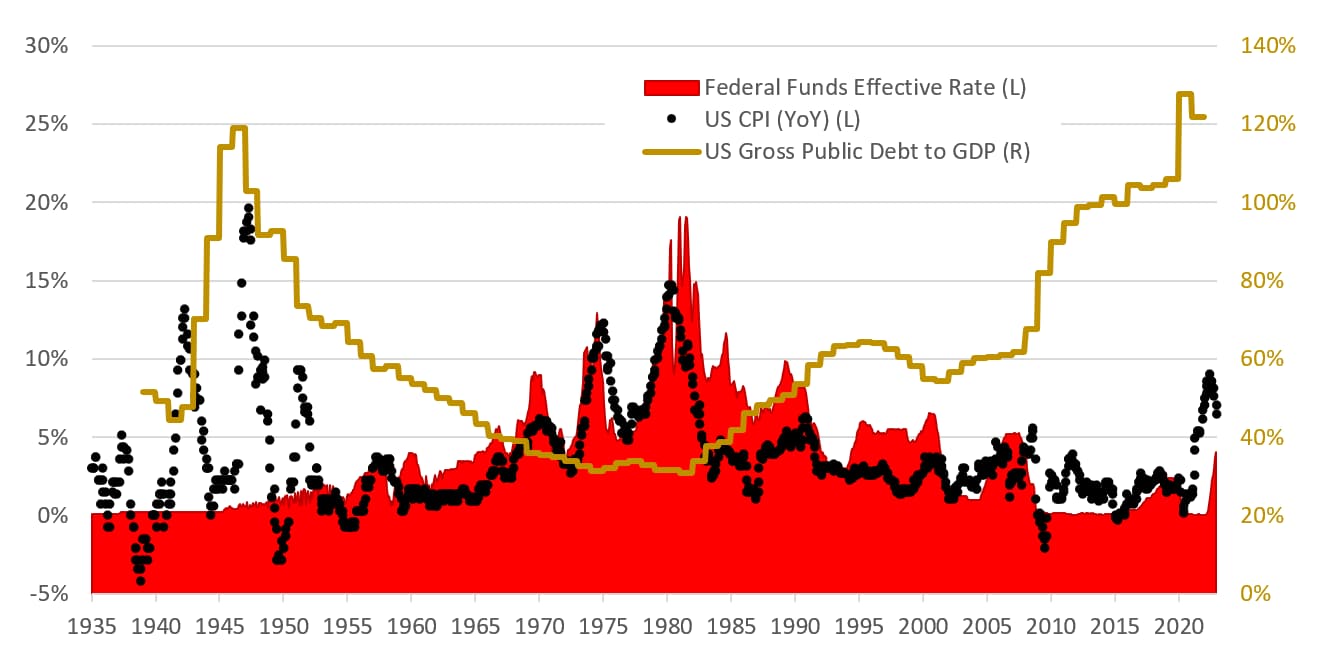
Let's begin by identifying the past inflationary periods. Below is the US year-on-year consumer price index, the federal funds effective rate and the US debt to GDP ratio from 1935 to today:
 Data Source: Prof.
Robert J. Shiller (http://www.econ.yale.edu/~shiller/data.htm),
Federal Reserve Bank of St. Louis
(https://fred.stlouisfed.org/)
We see two major inflationary periods - the post-World War 2 period in the 1940's and the 1970's. Comparing and contrasting the periods, both experienced multiple waves of inflationary peaks which lasted a decade or more, while we also see a near mirror image in the federal funds rate and the debt-to-GDP between the two periods.
While the public discourse on inflation often references the inflationary period in the 1970s, it has been pointed out that the present inflationary environment is much more reminiscent of the 1940s . There is a parallel between World War II and COVID-19 where governments enacted policies that artificially suppressed spending by rationing and price controls for the former and mandatory lockdowns for the latter. Another parallel is the high debt-to-GDP ratio; this is relevant to inflation since high debt levels hinder the Federal Reserve's only tool to fight it: raising interest rates. We argue that the present has elements of both the 1940s and 1970s inflationary periods and, consequently, synthesizing the appropriate stress scenario over the coming years will require a surgical application of correlation analysis.
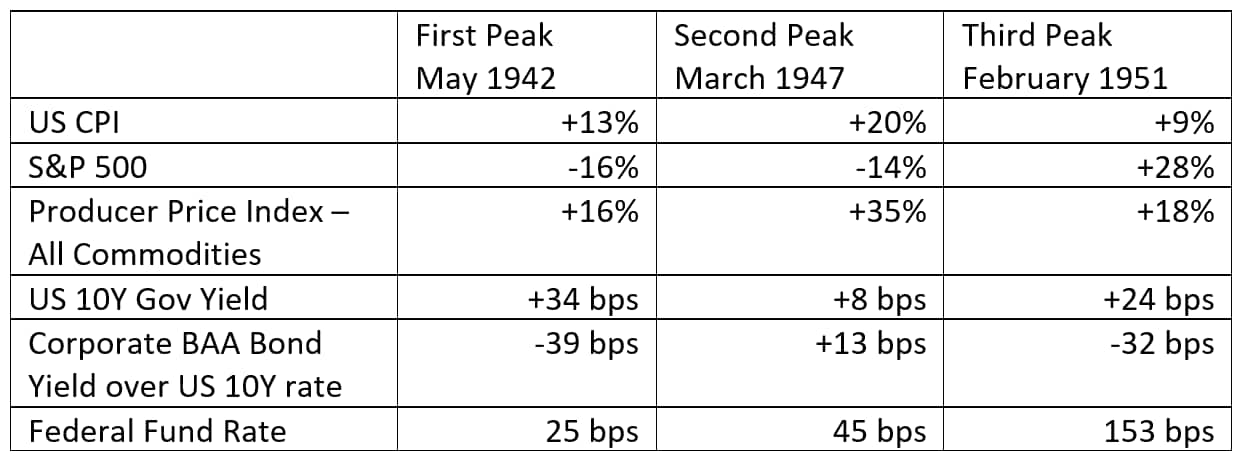
The returns of the stock, commodity, and bond markets over the 1-year period leading to the three inflationary peaks from 1942-1951, as well as the federal funds effective rates at the peak, are tabulated below.
 Data Source: Prof. Robert J.
Shiller (http://www.econ.yale.edu/~shiller/data.htm),
Federal Reserve Bank of St. Louis
(https://fred.stlouisfed.org/)
The post-war inflationary spikes had surprisingly minimal impact on the government and corporate bond market, likely due to a tightly held peg in the federal funds rate prior to the Treasury-Federal Reserve Accord of 1951; indeed, President Truman's intent for keeping rates artificially low was to maintain the value of war bonds[ii]. The economic boom and productivity gains in the 1950s were critical in allowing President Eisenhower to run a balanced budget and steadily reduce public debt, while also stabilizing the economy.
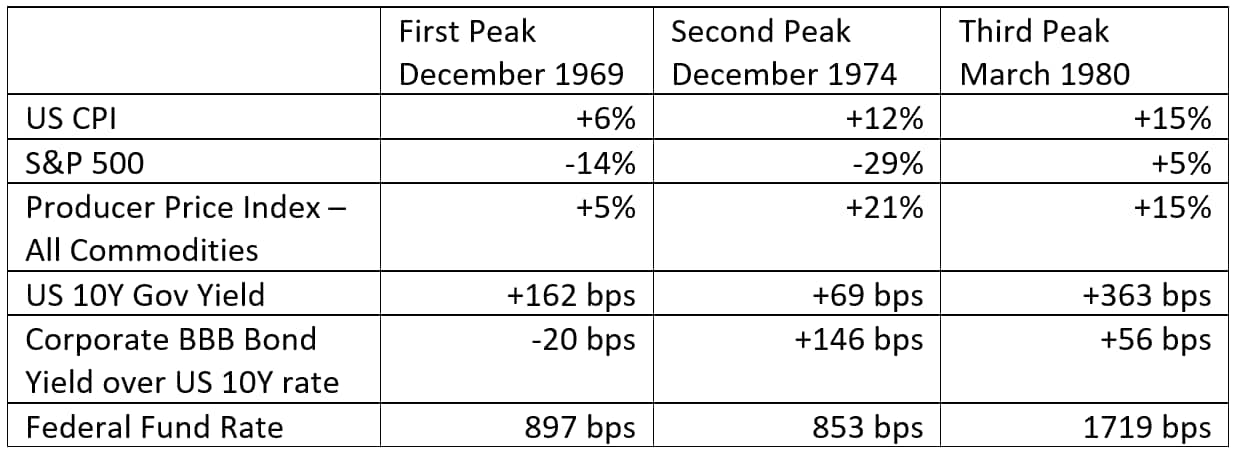
Next, we tabulate below the same values for the three inflationary peaks in and around the 1970's:
 Data Source: Prof. Robert J.
Shiller (http://www.econ.yale.edu/~shiller/data.htm),
Federal Reserve Bank of St. Louis
(https://fred.stlouisfed.org/)
These cycles were the first to test the post-Treasury-Federal Reserve Accord system for fighting inflation. In doing so, the Federal Reserve directed a much more aggressive hike in the federal funds rate, and despite rates that met or overshot the consumer price index (CPI), the first two peaks were followed by even larger peaks. It wasn't until then Federal Reserve Chairman Paul Volcker famously raised and sustained rates at stratospheric levels—at the expense of the markets and economy as a whole[iii]—that the decade of inflation finally ended. It should be noted, however, that Volcker had the luxury of aggressively raising rates during a time where the public debt (servicing) levels were at record lows.
And here we are today
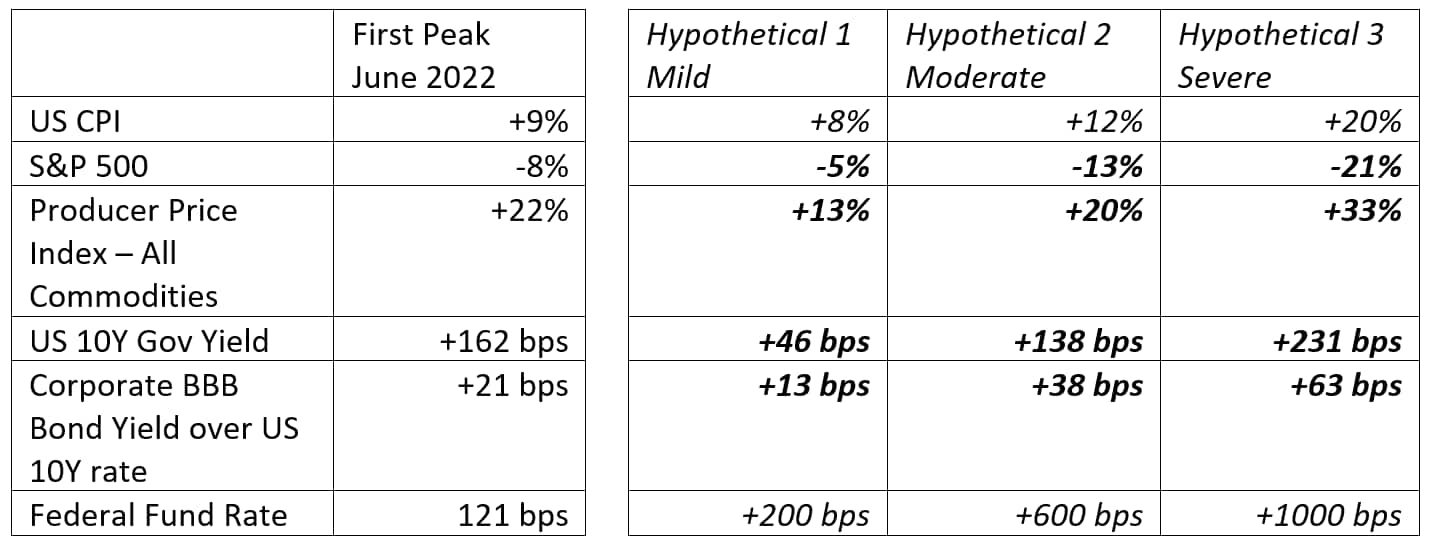
And here we are today, we have an independent Federal Reserve similar to the 1970s, but with record high levels of public debt like the 1940s. We already experienced an inflationary peak in June 2022, and if history tells us anything, it is conceivable that there could be more peaks over the next decade. Armed with historical data, we proceed to forecast three hypothetical scenarios of a peak in US CPI: mild (8%), moderate (12%), and severe (20%). The peak in June of 2022, as well as the three hypothetical scenarios, are tabulated below.
 Data Source: Prof. Robert J.
Shiller (http://www.econ.yale.edu/~shiller/data.htm),
Federal Reserve Bank of St. Louis
(https://fred.stlouisfed.org/)
We made subjective judgements on the US CPI and the federal funds rate (shown in italics in the hypothetical scenarios); the former is the independent driver that influences the Federal Open Market Committee (FOMC) to set the latter, which subsequently affects the stock and bond markets. Given the fiscal situation of the US Treasury, despite the independence of the Federal Reserve, we assume that a Volcker-style, sustained overshoot of the federal fund rates over the CPI is untenable in the present environment[iv]. The hypothetical returns for the stock, bond, and commodity risk factors (shown in bold italics) were calculated from historical correlations as described in the box below.
Note how, even in the severe scenario, the asset returns are less severe than the worst case among the tabulated six inflationary peaks. It is quite possible that the response from the Federal Reserve is much less aggressive than what the CPI prints, which would dampen the stock and bond market losses, but would likely unleash much higher commodity prices and CPI.
The hypothetical scenarios proposed above - per step 2 of the framework - can be fed into the inference stress testing feature in the Buy Side Risk Solution by S&P Global Market Intelligence to forecast effects of such market shock on a portfolio. The inference stress testing engine consumes stress scenarios of a set of risk factors - for example, the stock, commodities and bond market indices - and then evaluates the portfolio stress PnL based on historical correlations between the risk factors.
Conclusion
If the past historical inflationary cycles have taught us anything, it is that in the absence of a post-war-like productivity boom around the corner, the best tool for the Federal Reserve to tame inflation is a high and sustained federal funds rate. Since inflationary cycles can and have lasted for a decade or longer, asset managers must be cognizant of long-term macro risks such as sustained high inflation and/or high rates, a potential (re-)marriage of the Treasury and the Federal Reserve, as well as what the ramifications may be of a possible sovereign debt spiral.
Appendix: Calculation methodology of the hypothetical stock, bond yields and commodity returns
The broad market stock returns and changes to long-term government bond and corporate bond yields were computed based on historical correlations of these assets against changes to the federal fund rates. The correlations were taken over the 12 months leading up to the inflationary peaks in 1969, 1974, 1980, and 2022 (see table below), filtered by months with increases in the federal fund rates. The inflationary peaks prior to the Treasury-Federal Reserve Accord were omitted.
We assume the commodity prices are directly correlated to the US CPI and independent of the federal fund rates. The forecasts were based on correlations over the 12 months leading up to all six historical inflationary peaks described above, as well as the June 2022 peak.
[i] https://www.imf.org/en/Publications/WEO/Issues/2022/10/11/world-economic-outlook-october-2022
[ii] https://www.federalreservehistory.org/essays/treasury-fed-accord
[iii] The "double dip" recession of 1980 and 1981-82 was the worst economic downturn in the US since the Great Depression, where unemployment reached nearly 11% and GDP fell by 1.8%.
[iv] Based on the Congressional Budget Office data (as of March 2021), the baseline assumption that interest rates on all public debt to grow from 2.6% to 4.6% over the next 30 years projects a debt-to-GDP ratio of 202%. According to analysis done by the Manhattan Institute ("How Higher Interest Rates Could Push Washington Toward a Federal Debt Crisis" - December 22, 2021) on the CBO baseline data, a 1- and 2-percentage point additional rise in interest rates to the baseline rate projects 243% and nearly 300% debt-to-GDP ratio, respectively; in the latter case, the article notes, the interest would consume 100% of all projected tax revenues.
S&P Global provides industry-leading data, software and technology platforms and managed services to tackle some of the most difficult challenges in financial markets. We help our customers better understand complicated markets, reduce risk, operate more efficiently and comply with financial regulation.
This article was published by S&P Global Market Intelligence and not by S&P Global Ratings, which is a separately managed division of S&P Global.
{"items" : [
{"name":"share","enabled":true,"desc":"<strong>Share</strong>","mobdesc":"Share","options":[ {"name":"facebook","url":"https://www.facebook.com/sharer.php?u=http%3a%2f%2fstage.www.spglobal.com%2fmarketintelligence%2fen%2fmi%2fresearch-analysis%2fbuyside-risk-managers-constructing-inflationary-stress-tests.html","enabled":true},{"name":"twitter","url":"https://twitter.com/intent/tweet?url=http%3a%2f%2fstage.www.spglobal.com%2fmarketintelligence%2fen%2fmi%2fresearch-analysis%2fbuyside-risk-managers-constructing-inflationary-stress-tests.html&text=A+Framework+for+Buy-side+Risk+Managers%3a+Constructing+Inflationary+Stress+Tests+%7c+S%26P+Global+","enabled":true},{"name":"linkedin","url":"https://www.linkedin.com/sharing/share-offsite/?url=http%3a%2f%2fstage.www.spglobal.com%2fmarketintelligence%2fen%2fmi%2fresearch-analysis%2fbuyside-risk-managers-constructing-inflationary-stress-tests.html","enabled":true},{"name":"email","url":"?subject=A Framework for Buy-side Risk Managers: Constructing Inflationary Stress Tests | S&P Global &body=http%3a%2f%2fstage.www.spglobal.com%2fmarketintelligence%2fen%2fmi%2fresearch-analysis%2fbuyside-risk-managers-constructing-inflationary-stress-tests.html","enabled":true},{"name":"whatsapp","url":"https://api.whatsapp.com/send?text=A+Framework+for+Buy-side+Risk+Managers%3a+Constructing+Inflationary+Stress+Tests+%7c+S%26P+Global+ http%3a%2f%2fstage.www.spglobal.com%2fmarketintelligence%2fen%2fmi%2fresearch-analysis%2fbuyside-risk-managers-constructing-inflationary-stress-tests.html","enabled":true}]}, {"name":"rtt","enabled":true,"mobdesc":"Top"}
]}


