Customer Logins
Obtain the data you need to make the most informed decisions by accessing our extensive portfolio of information, analytics, and expertise. Sign in to the product or service center of your choice.
Customer Logins

BLOG
Apr 28, 2022
CDS activity – this time really is different

"This time is different." Four words that should strike fear into the minds of investors, as eloquently shown in the eponymous book by Reinhart and Rogoff (2009). As we head into a tightening cycle that should certainly be borne in mind, but when comparing derivative market conditions in 2020 to the current situation - as many are doing - it is apparent that this time really is different.
On a superficial level, there are some similarities. Credit spreads are widening in expectation of higher defaults and banks are increasing loan loss provisions. But on closer examination markets during the respective periods are behaving in distinctly different ways.
Take the CDS market, for example. In times of perceived credit deterioration - applicable to both March/April 2020 and the present day - CDS typically attracts more interest and trades in higher volume. This reflects its utility in hedging credit risk as well as its flexibility in alpha generating strategies.

Chart 1. Notional traded in CDS indices (5-day moving average)
Source: OSTTRA/ S&P Global Market Intelligence. Data compiled April 22, 2022
Higher volumes did indeed materialise in 2020 and 2022, but chart 1 shows that the scale and longevity of the upswing differed. In March and April 2020, when the markets reacted to the onset of the COVID-19 pandemic, volumes in the CDX IG and iTraxx Europe rose dramatically. In contrast, volumes were already increasing in the last quarter of 2021 and continued to do so in the first quarter of 2022, though by a more modest amount. Note that both periods included an index roll, which inevitably boosts volumes. But the differences between the periods are clear, both in scale and longevity.
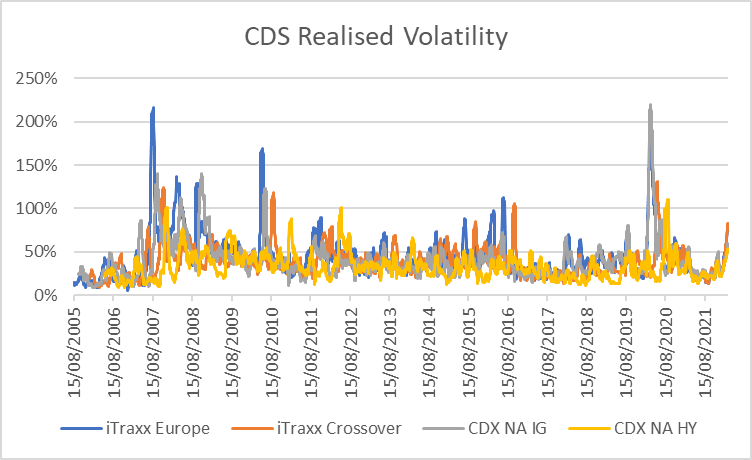
Chart 2. Realised Volatility (20-day) in CDS indices
Source: S&P Global Market Intelligence. Data compiled April 22, 2022
The fear and uncertainty pervading the market - as reflected by asset price volatility - offers another stark comparison. Realised volatility in CDS indices reached levels on a par with the GFC before recovering rapidly to a more "normal" plane. While volatility has increased since Q4 2021, it has been a steady increase and levels - while high - are nothing out of the ordinary and a fraction of what we saw during March/April 2020.
The rampant uncertainty sparked by the pandemic led to a serious diminution of liquidity, a factor that exacerbated volatility. Liquidity decay was even evident in traditionally robust instruments such as US Treasuries so it was no surprise that it was conspicuous in derivatives. Activity in CDS indices was strong throughout, as we have already seen. The picture in single name CDS was more mixed.
Chart 3 shows the dispersion of dealer contributions to S&P Global's CDS composite levels*. The 5-year tenor is by far the most liquid, and dispersion is therefore tighter than in the other maturity points. Nonetheless, the febrile conditions of 2020 resulted in dispersion increasing significantly before reverting to trend. This pattern was even more pronounced at the less liquid short- and long-end of the curve.

Chart 3. Dispersion of single name CDS contributions
Source: S&P Global Market Intelligence. Data compiled April 22, 2022
There was some evidence that current market conditions have increased dispersion. But the impact is modest in comparison to 2020 and within a reasonable range.
One may ask what tangible effect rising dispersion in pricing has on financial institutions. For European banks there is a direct impact through the EU Prudent Valuation Regulation. This was introduced in 2016 to ensure fair valued instruments are prudently valued - reflecting additional factors such as market price uncertainty (effectively dispersion), concentration risk and several others. The higher the dispersion, the higher the additional valuation adjustment, with a consequent negative impact on Core Equity Tier One (CET1) capital.
In 2020 the European Banking Authority (EBA) amended the Prudent Valuation regulation by increasing the aggregation factor from 50% to 66%. This aggregation factor reflects that some individual AVAs will overlap when aggregated at the category level. Increasing the aggregation factor, therefore, gave banks material relief on the capital charges resulting from higher uncertainty and dispersion.
This provision has long expired and the EBA has refrained from taking similar action in the current period. That it hasn't done so is perhaps a reflection of the differences between 2020 and 2022 highlighted above. In 2020, the EBA underlined the "extreme volatility" that resulted in the Prudent Valuation regulation having an "excessive procyclical impact". As we saw in chart 2, volatility has increased in 2022 but it couldn't be described as extreme (though there may be evidence of extremities in other asset classes, such as commodities).
The current period is in some respects a more typical shift in the business cycle. Inflation is rising - exacerbated by the Russia-Ukraine conflict - and central banks are tightening policy as a result. The positive credit momentum of the past 14 months has been halted, with S&P Global Ratings expecting a rise in default rates to 3% in the U.S. and 2.5% in Europe (with uncertainties possibly pushing defaults above forecasts).
Price formation can be challenging away from the very liquid portion of the financial markets. This remains the case and both cash and derivative instruments are prone to price dispersion. This can create uncertainty and have a direct impact through regulations such Prudent Valuation. But it can also affect valuation uncertainty in a wider context, not just for banks but for buy-side institutions such as asset managers. This is a developing theme given the disruption to markets that was evident in 2020. As yet, this hasn't been repeated but market participants need to be prepared for such events in a more volatile world.
*Calculated by the sum of standard deviations of passed dealer contributions divided by consensus conventional spreads
S&P Global provides industry-leading data, software and technology platforms and managed services to tackle some of the most difficult challenges in financial markets. We help our customers better understand complicated markets, reduce risk, operate more efficiently and comply with financial regulation.
This article was published by S&P Global Market Intelligence and not by S&P Global Ratings, which is a separately managed division of S&P Global.
{"items" : [
{"name":"share","enabled":true,"desc":"<strong>Share</strong>","mobdesc":"Share","options":[ {"name":"facebook","url":"https://www.facebook.com/sharer.php?u=http%3a%2f%2fstage.www.spglobal.com%2fmarketintelligence%2fen%2fmi%2fresearch-analysis%2fcds-activity-this-time-really-is-different.html","enabled":true},{"name":"twitter","url":"https://twitter.com/intent/tweet?url=http%3a%2f%2fstage.www.spglobal.com%2fmarketintelligence%2fen%2fmi%2fresearch-analysis%2fcds-activity-this-time-really-is-different.html&text=CDS+activity+%e2%80%93+this+time+really+is+different+%7c+S%26P+Global+","enabled":true},{"name":"linkedin","url":"https://www.linkedin.com/sharing/share-offsite/?url=http%3a%2f%2fstage.www.spglobal.com%2fmarketintelligence%2fen%2fmi%2fresearch-analysis%2fcds-activity-this-time-really-is-different.html","enabled":true},{"name":"email","url":"?subject=CDS activity – this time really is different | S&P Global &body=http%3a%2f%2fstage.www.spglobal.com%2fmarketintelligence%2fen%2fmi%2fresearch-analysis%2fcds-activity-this-time-really-is-different.html","enabled":true},{"name":"whatsapp","url":"https://api.whatsapp.com/send?text=CDS+activity+%e2%80%93+this+time+really+is+different+%7c+S%26P+Global+ http%3a%2f%2fstage.www.spglobal.com%2fmarketintelligence%2fen%2fmi%2fresearch-analysis%2fcds-activity-this-time-really-is-different.html","enabled":true}]}, {"name":"rtt","enabled":true,"mobdesc":"Top"}
]}