Customer Logins
Obtain the data you need to make the most informed decisions by accessing our extensive portfolio of information, analytics, and expertise. Sign in to the product or service center of your choice.
Customer Logins
BLOG
Jul 31, 2020
Daily Global Market Summary - 31 July 2020
European equity markets closed lower across the region for the second consecutive day and most APAC markets also ended lower except for China. US equities were lower for most of the trading session, but most closed higher, except for the Russell 2000, after a late-afternoon rally. Both iTraxx and CDX indices closed almost flat on the day across IG/high yield, with CDX tightening from its lowest point of the day alongside the rally in US equities. Gold broke new records again today and both Brent/WTI closed higher.
Americas
- Most US equity markets closed higher, except for the Russell 2000 -1.0%, after suddenly rallying from near the lows of the day beginning at 2:10pm EST; Nasdaq +1.5%, S&P 500 +0.8%, and DJIA +0.4%.
- 10yr US govt bonds closed -2bps/0.54% yield and 30yr bonds -1bp/1.20% yield.
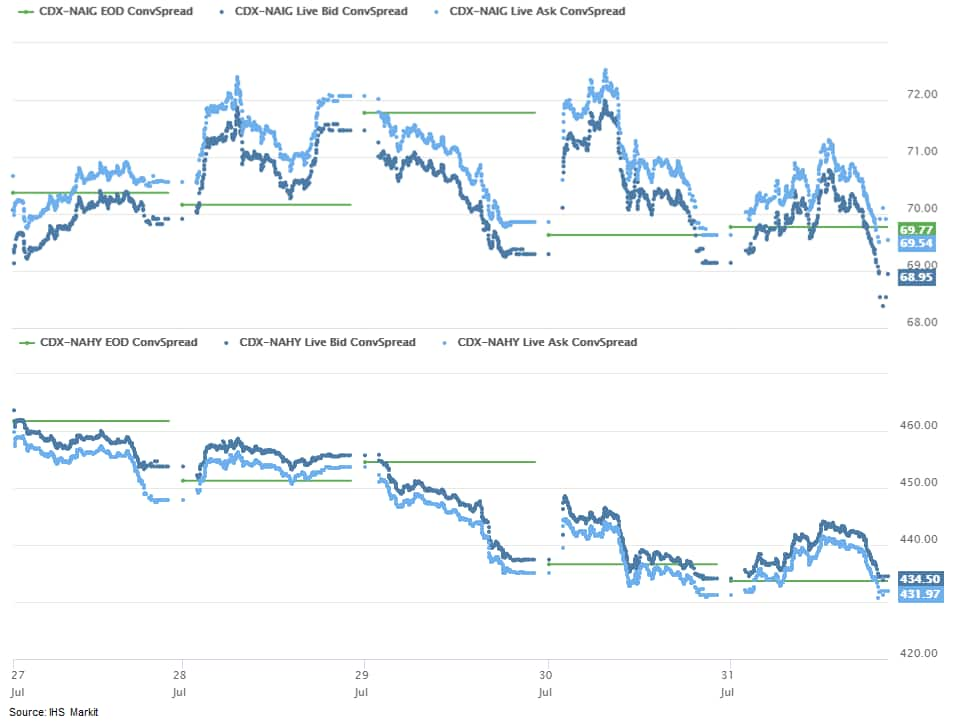
- CDX-NAIG closed -1bp/69bps and CDX-NAHY flat/433bps, which is
-1bp and -29bps, respectively, week-over-week.
- Gold closed +2.2%/$1,986 per ounce to another record high close and earlier in the day reached a new all-time intraday high of $1,996.80 per ounce before the New York market open.
- Crude oil closed +0.9%/$40.27 per barrel.
- Coronavirus cases in the U.S. increased 0.5% at 11:04 a.m. compared with the same time Thursday to 4.5 million, according to data collected by Johns Hopkins University and Bloomberg News. The increase was below the average 1.6% daily gain over the past week. Deaths rose 0.3% to 152,074. (Bloomberg)
- The University of Michigan US Consumer Sentiment Index fell 5.6
points (7.2%) to 72.5 in July, giving up essentially all of its
gains in June. The reading is consistent with our expectation for
slower growth in consumer spending over the next several months.
(IHS Markit Economist David Deull and James Bohnaker)
- The final reading represented a 0.7-point decrease from the preliminary reading, suggesting that optimism dampened over the course of the month.
- The current conditions index fell 4.3 points in July, to 82.8, while the expectations index fell 6.4 points to 65.9.
- Regional changes in consumer sentiment in the latter half of July continued to defy the pattern traced by the worst effects of the pandemic. Sentiment in the Northeast region plunged 16.6 points despite a relatively low and stable rate of new COVID-19 infections. In contrast, consumer sentiment in the South increased 1.0 point and left the region's level at 78.3. The spread between the region with the highest level of consumer sentiment (the South) and the lowest (the West) was 14.4 points.
- Consumer sentiment fell 5.7 points to 75.9 among households earning more than $75,000 a year and fell 6.2 points to 67.2 among lower-earners.
- Buying conditions were mixed in July. The index of buying conditions for large household durable goods retreated 9 points to 106, while that for vehicles dove 16 points to 124. The index of buying conditions for homes rose 3 points to 133, just shy of its 2019 average.
- The index of consumers' views on their current financial situation relative to a year earlier plunged from 141 in February to 106 in April. It has remained essentially unchanged since, and was 108 in July. Though the lack of improvement in this measure is notable, so is its still elevated level, which reflects a greater proportion of respondents reporting improvement (39%) than decline (31%). The lowest point for this index after the Great Recession, in September 2009, was 58. Fiscal stimulus has cushioned much of the economic blow to households from the current recession so far.
- US personal income decreased 1.1% in June and real disposable
personal income (DPI) declined 1.8%. The decrease in personal
income primarily reflected dwindling "economic impact payments" as
more than 98% of the rebates issued through June were disbursed in
April and May. (IHS Markit Economists James Bohnaker and David
Deull)
- Partially offsetting the decrease in other government social benefits was a $110.7-billion (annual rate) increase in unemployment insurance thanks to pandemic-related programs that were supporting more than 30 million people at the end of June.
- Employee compensation and proprietors' income also increased as more businesses reopened. More than two-thirds of the increase in proprietors' income was accounted for by additional loans to businesses as part of the Paycheck Protection Program (PPP).
- Real personal consumption expenditures (PCE) increased 5.2% in June to a level that was 6.6% below the pre-pandemic peak in February. This was stronger than expected and resulted in a 2.9-percentage-point upward revision to our forecast for third-quarter growth of real PCE.
- With outlays partially catching up with personal income in June, the personal saving rate eased from 24.2% to 19.0%.
- This release incorporated annual revisions for the previous five years. In 2019, personal income was 0.3% lower than previously reported and outlays were revised down less than 0.1%—not enough to impact our outlook.
- Despite the strong initial rebound in consumer spending through June, fading fiscal support and elevated COVID-19 infection rates in some parts of the country point to a stalling recovery in real PCE over the next few months.
- Microsoft Corp. is exploring an acquisition of TikTok's operations in the U.S., according to a people familiar with the matter. A deal would give the software company a popular social-media service and relieve U.S. government pressure on the Chinese owner of the video-sharing app. (Bloomberg)
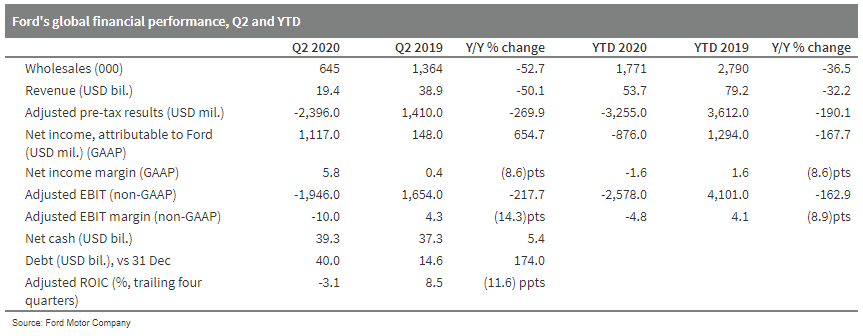
- Ford has reported better-than-expected financial results in the
second quarter, recording net income of USD1.1 billion, assisted by
a USD3.5-billion gain from Argo AI. However, Ford recorded an
adjusted EBIT loss of USD1.95 billion in the second quarter. <span/>(IHS Markit
AutoIntelligence's Stephanie Brinley)
- In the second quarter, Ford's revenues fell 50.1% year on year (y/y) to USD19.4 billion on business disruption from halted production and sales in Europe and the Americas roughly from March through May because of the COVID-19 pandemic.
- In the year to date (YTD; January to June), Ford's revenues dropped 32.2% y/y to USD53.7 billion.
- Ford reported net income of USD1.1 billion in the second quarter, as a result of a USD3.5-billion gain as Argo AI was deconsolidated after Volkswagen (VW)'s investment in June .
- Although Argo AI has been deconsolidated, Ford chief financial officer (CFO) Tim Stone stated that this will not change the automaker's planned investment in autonomous vehicles. The timing of the USD3.5-billion gain was a significant factor in the company's second quarter being stronger than expected.
- In the second quarter, Ford's adjusted EBIT loss was USD1.95 billion, compared with adjusted EBIT of USD1.65 million a year earlier.
- In an effort to ensure the company has sufficient liquidity to weather the difficult market conditions in the coming months and to support key launches, Ford drew on credit lines and its debt increased to USD40.0 billion at the end of the second quarter, from USD15.3 billion at 30 June 2019.
- Lower volumes and poorer mix impacted on Ford's adjusted EBIT
by USD5.7 billion in the second quarter, easily the most notable
impact, although net pricing did have a USD1.3-billion positive
impact on adjusted EBIT.
- Dana has reported a sales decrease of 53% year on year (y/y) to
USD1.08 billion in the COVID-19-pandemic-hit second quarter of
2020. (IHS Markit AutoIntelligence's Stephanie Brinley)
- Dana's second-quarter sales were down from USD2.3 billion in second quarter 2019, a decline attributable to weaker demand across all mobility markets as customers idled operations over much of the quarter because of COVID-19 virus containment measures.
- The conditions caused Dana to report an increased quarterly net loss of USD174 million, compared with a net loss of USD68 million in second quarter 2019.
- Along with pandemic impacts, Dana reported higher income tax expenses in the second quarter of 2020 and settlement charges.
- Dana reports that, excluding charges, the second-quarter net loss was USD118 million, compared with net income of USD103 million in the second quarter of 2019.
- Dana reported an adjusted EBITDA loss of USD5 million in the second quarter, versus USD286-million profit a year earlier, which Dana stated was the result of halted production, offset by targeted management cost actions and a production restart in May.
- Dana chief financial officer Jonathan Collins said, "Our timely cost saving actions and operational flexibility have served us well as we managed through this difficult quarter. We remain confident in our ability to capitalize on improving market conditions over the balance of the year."
- Visteon has reported its financial results for the second
quarter, including a 49.4% year-on-year (y/y) decline in net sales
to USD371 million and a net loss of USD45 million. (IHS Markit
AutoIntelligence's Stephanie Brinley)
- The auto industry supplier said the sales decrease in the second quarter was on production declines related to plant shutdowns because of the COVID-19 pandemic, driving the net loss and a reduced gross margin.
- In the second quarter, Visteon's sales were down from USD733 million in the corresponding quarter of 2019.
- Visteon states that its gross margin fell to USD4 million in the second quarter, compared with USD70 million a year earlier.
- The company's net loss attributable to Visteon of USD45 million in the second quarter compares with net income of USD7 million in the corresponding quarter of 2019.
- The second-quarter loss included a USD4-million charge on a recently introduced restructuring program.
- In the year to date, Visteon has reported USD1.7 billion in lifetime sales, mostly from digital instrument clusters, infotainment, and displays. The company's adjusted net loss was USD42 million in the second quarter, from income of USD8 million a year earlier.
- Visteon's adjusted EBITDA fell to a loss of USD3 million in the second quarter, compared with USD46 million in second quarter 2019.
- In the company statement, president and CEO Sachin Lawande said, "Visteon took decisive actions in the second quarter to reduce its cost base in response to decreased automotive industry activity. Despite the challenging environment, we launched 21 new products during the first half of the year, including all-digital clusters, a new Android-based infotainment system and large displays. We also won USD1.7 billion in new business in the first half, which will position us for continued market outperformance in the future."
- The benchmark September robusta coffee contract set a fresh 7-1/2-month high of USD1,381 a ton on Thursday before settling at USD1,340 a ton, down USD4 on the day. The market was supported by news of a fresh coronavirus outbreak in top producer Vietnam which is facing tight supplies at the end of the season anyway. Second-month November finished USD2 lower at USD1,356 a ton, while the back months ended between flat and up USD4. Trading volume rose to 29,314 lots from 21,435 a day earlier amid suspected activity by speculators. Arabica futures in New York continued to post strong gains amid concern over an adverse effect of the global COVID-19 pandemic on coffee production in the upcoming 2020/21 harvests in Latin America. That said, the most-active September arabica contract added another 3.75¢ to settle at 115.35¢/lb, after rising as high as 117.40¢/lb earlier in the session, the highest since mid-April. The intraday low was hit at 112.20¢/lb. Second-month December also gained 3.75¢ to settle at 118.25¢/lb, while the rest of the board gained between 2.55 and 3.55¢ with the gains the higher the nearer the delivery period was. Trading volume increased to 77,964 contracts from 66,227 a day earlier. The gains in the arabica market elevated the arabica premium over robusta to a 2-1/2-month high of 54.57¢/lb, up from 50.64 a day earlier. (IHS Markit Food and Agricultural Commodities' Stefan Uhlenbrock)
Europe/Middle East/ Africa
- European equity markets closed lower across the region for the second consecutive day; Spain -1.7%, UK -1.5%, France -1.4%, Italy -0.7%, and Germany -0.5%.
- 10yr European govt bonds closed lower across the region; Italy +4bps, Germany/France/UK +2bps, and Spain +1bp.
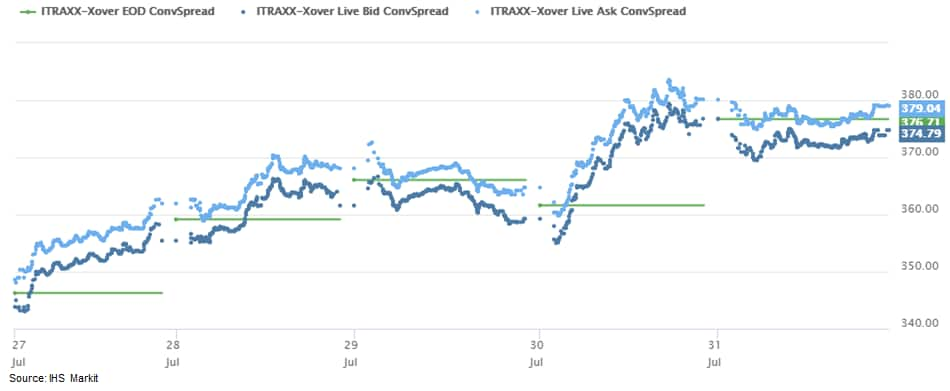
- iTraxx-Europe flat/61bps and iTraxx-Xover flat/377bps, which is
+2bps and +31bps, respectively, week-over-week.
- Brent crude closed +0.6%/$43.52 per barrel.
- Following a (slightly upwardly revised) record 3.6%
quarter-on-quarter (q/q) contraction in the first quarter of 2020,
eurozone GDP contracted by 12.1% q/q in the second quarter, broadly
in line with market consensus expectations according to Refinitiv
(-12.0%) and IHS Markit's forecast (-11.9%). On a year-on-year
(y/y) basis, GDP dropped by 15.0% in the second quarter following a
decline of 3.1% in the first. (IHS Markit Economist Ken Wattret)
- To put these huge falls into perspective, the previous record contractions in eurozone GDP were 3.2% q/q and 5.7% y/y in the first quarter of 2009 amid the global financial crisis (see first chart below).
- Eurostat's "preliminary flash" estimate is based on the data of 16 of 19 member states, covering 93% of eurozone GDP; given the exceptional circumstances of the COVID-19 virus pandemic, subsequent revisions are likely. The subsequent "flash" estimate for the second quarter will be released on 14 August, along with the first estimate of employment in the quarter, although a breakdown by expenditure component will follow only on 8 September.
- National releases and higher-frequency data already available suggest another quarter of broad-based weakness, reflecting the most intensive phase of COVID-19 virus-related restrictions, with private consumption, business investment, and exports all likely to have collapsed.
- In the larger member states, there were huge declines across the board but significant variations. Germany outperformed, as predicted, although its 10.1% q/q decline was larger than expected, as was the collapse in Spain (-18.5% q/q). France (-13.8% q/q) and Italy (-12.4% q/q) saw smaller-than-expected q/q declines, although both were still record contractions by some distance.
- The National Statistics Institute (Instituto Nacional de
Estadística: INE) reports that Spain endured its first recession
since the third quarter of 2013 in the first half of this year.
Specifically, the economy shrank by a record 18.5% quarter on
quarter (q/q) in the second quarter, after a 5.2% q/q drop in the
first, the biggest GDP loss since the second half of 2013. (IHS
Markit Economist Raj Badiani)
- In annual terms, the economy was down by 22.1% year on year (y/y) in the second quarter, after a 4.1% y/y drop in the first.
- The fall in economic activity during the lockdown was greater in Spain than in the eurozone as a whole, owing to more stringent anti-contagion measures and its large and exposed tourism and hospitality sectors.
- The GDP losses in the second quarter were sharper than expected, with IHS Markit estimating that real GDP shrank by 16.1% q/q and 19.9% y/y.
- The expenditure breakdown reveals that the anti-contagion measures triggered a sizeable domestic demand shock in the second quarter.
- Consumer spending fell more markedly owing to the closure of leisure establishments, accommodation, and non-essential retail premises for part of the second quarter, declining by around 25% both over the quarter and the year.
- Household incomes were affected, with the lockdown triggering a wave of job losses despite extensive government support schemes.
- Not surprisingly, the measures and precautions to contain the COVID-19 virus outbreak and public health concerns decimated household confidence. As a result, Spanish households are saving more, partly driven by greater fears around future job security.
- Fixed investment contracted markedly during the second quarter, by 21.9% q/q and 25.8% y/y. A breakdown by asset reveals a broad-based and severe decline, led by a collapse in construction of dwellings and other buildings and structures alongside markedly lower spending on machinery and equipment. The industrial climate was notably more challenging, partly due to a collapse in corporate financials and plunging manufacturing activity.
- Net exports were a drag on activity, with exports and imports falling by 33.5% q/q and 28.8% q/q, respectively.
- French GDP collapsed by 13.8% quarter on quarter (q/q) during
the second quarter of 2020, according to a seasonally adjusted
"flash" estimate released by the National Institute of Statistics
and Economic Studies (Institut national de la statistique et des
études économiques: INSEE). Output is now estimated to have fallen
by 5.9% q/q during the first quarter, revised from a previous
estimate of a 5.3% q/q decline. The economy has now contracted for
three consecutive quarters. (IHS Markit Economist Diego Iscaro)
- On a year-on-year (y/y) basis, GDP declined by 19.0% during the second quarter. Both the q/q and y/y declines are the strongest in the post-war period.
- Unsurprisingly, domestic demand was badly hit following the implementation of a strict lockdown between mid-March and mid-May in response to the COVID-19 virus outbreak. Private consumption fell by 11.2% q/q in the second quarter, dragged down by a sharp decline in consumption of services (-15.3% q/q). Consumption of goods dropped by a more moderate 7.1% q/q. Public consumption fell by 8.0% q/q.
- Investment spending was also severely affected by a combination of the lockdown, falling demand, and a general increase in uncertainty, declining by 17.8% q/q. Construction activity was particularly hit as building sites had to suspend their activities during the confinement period (-26.2% q/q), while investment in manufactured goods shrank by 23.1% q/q.
- Plummeting external demand, and the impact of the lockdown on production and some services (e.g., tourism), led to a 25.5% q/q fall in exports of goods and services. The INSEE mentioned that exports of transport equipment fell particularly strongly during the second quarter. Meanwhile, imports of goods and services declined by 17.3% q/q.
- More encouragingly, figures also released by the INSEE show that consumption of goods (which accounts for around one-third of total consumption) rose by 9.0% month on month (m/m) in June. This followed an increase of 37.4% m/m in May. Consumption of goods, which had collapsed by 16.0% m/m and 18.7% m/m in March and April, respectively, is now 2.3% above its February pre-COVID-19 level.
- Groupe PSA has announced a new electric vehicle (EV) platform that will underpin its larger electrified future model ranges, according to a company press statement. The new architecture will be known as eVMP and will be used for future EV model ranges in the C and D segments with sedan, sport utility vehicle (SUV), and crossover body styles in all the major global markets in which the automaker operates. The architecture will support battery-pack energy of between 60 and 100 kWh, with the cells packed into the floor of the platform. PSA says that by offering 50 kWh per meter within the wheelbase, which is increasingly seen as a benchmark in the EV market, it will be able to offer vehicles with a competitive all-electric range of between 400 km and 650 km on the Worldwide harmonized Light vehicles Test Procedure (WLTP) cycle. The new platform will complement smaller sub-C-segment models based on the e-CMP platform, with this architecture and the new eVMP architecture underpinning the vast majority of PSA's EV offerings over the next decade. (IHS Markit AutoIntelligence's Tim Urquhart)
- According to its flash release, ISTAT estimates that the
Italian economy shrank by 12.4% quarter on quarter (q/q) in the
second quarter and was 17.3% smaller than a year earlier. (IHS
Markit Economist Raj Badiani)
- This implies that Italy remains in a technical recession (defined as two successive quarters of q/q decline) after it contracted by 5.4% q/q in early 2020 and 0.2% q/q in the fourth quarter of 2019.
- ISTAT has not provided a detailed breakdown but has confirmed severe falls in value added in industry and services. On the expenditure side, it reports anticipated negative contributions from both domestic demand and net exports.
- This is broadly in line with IHS Markit's second-quarter assessment in our July update, when we estimated that real GDP shrank by 13.0% q/q and 17.8% year on year (y/y).
- Growth should return from the third quarter of 2020 in line with the steady lifting of the COVID-19 virus-related lockdown. The economy is likely to expand by around 6.0% q/q in the third quarter and by 2.8% q/q in the fourth.
- Italian brake manufacturer Brembo has announced that it has raised its stake in Pirelli to almost 5%. In a statement made as part of its first-half 2020 financial results, the company said that its stake in the tire-maker now stands at 4.99%, with shares acquired by Brembo directly and through its parent company Nuova FourB. It added that the acquisition was undertaken as a "long-term, non-speculative approach". (IHS Markit AutoIntelligence's Ian Fletcher)
Asia-Pacific
- Most APAC equity markets closed lower except for China +0.7%; Japan -2.8%, Australia -2.0%, South Korea -0.8%, Hong Kong -0.5%, and India -0.3%.
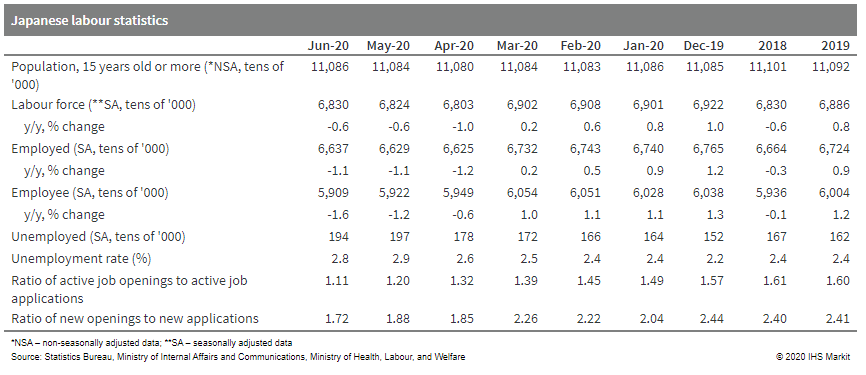
- Japan's unemployment rate fell to 2.8% in June from 2.9% in
May, thanks to an increase in the number of self-employed from the
previous month, but the number of non-regular employees continued
to decline in line with rising unemployment because of severe
circumstances of employers or businesses. Declines in the number of
employees in life-related services, accommodations, and drinking
and eating services remained the major factor behind weak labor
demand. (IHS Markit Economist Harumi Taguchi)
- Thanks to the reopening of businesses, new job openings for June rose month-on-month for a second consecutive month, but the year-on-year contraction widened to 27.4%. A faster increase in new applications lowered both the ratio of active job openings to active job applications (to 1.11) and the ratio of new openings to new applications (1.72).
- Weak employment conditions also weighed on consumer sentiment.
The Consumer Confidence Index improved 1.1 points to 29.5 in July
but remained below the March level. The employment sub indicator
rose only 0.8 point to 21.7.
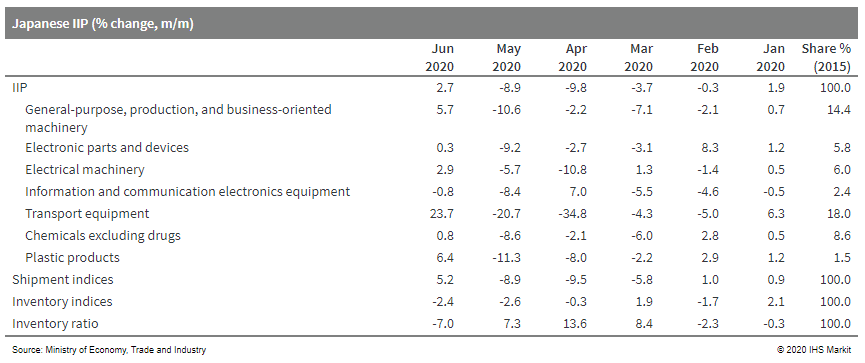
- Japan's index of industrial production (IIP) rose by 2.7% month
on month (m/m) in June, the first increase in five months, but a
16.7% quarter-on-quarter (q/q) drop in the second quarter was the
largest contraction since the first quarter of 2019. (IHS Markit
Economist Harumi Taguchi)
- Manufacturers' shipments rose by 5.2% m/m in June, outpacing the rebound in the IIP and contributing to the third straight month of decline in inventory, while the index of inventory ratio declined by 7.0% m/m following three consecutive months of increase.
- The improvement in the IIP largely reflected solid rebounds in vehicle production (up 28.9% m/m) and production machinery (thanks to the resumption of production after the lifting of the COVID-19 virus-related state of emergency), easing supply-chain disruption, and increases in orders. Inventory declined in a broad range of industry groupings, particularly for vehicles and electric parts and devices.
- Industry expects solid recoveries in production to continue in
June (up 11.3% m/m) and July (up 3.4% m/m), driven by transport
equipment, chemical products, electric products and parts, and
general-purpose and business-oriented machinery. However, even if
the actual results match the industry outlook, the level of
production could remain below the March level.
- Japanese vehicle production witnessed another sharp decline in
May due to the impact of the COVID-19 virus outbreak. Volumes
totaled 308,061 units in the month, down 61% year on year (y/y),
according to figures released by the Japan Automobile Manufacturers
Association (JAMA). The figure includes passenger vehicles, trucks,
and buses. (IHS Markit AutoIntelligence's Isha Sharma)
- Output in the passenger car category reached 251,384 units during the month, down 63% y/y. Within the passenger car category, production of standard cars with an engine displacement of more than 2.0 liters fell by 71.3% y/y to 122,179 units, while output of small vehicles was down by 37.7% y/y to 80,401 units.
- Production of minivehicles, categorized as vehicles equipped with engines smaller than 660cc, was down by 60% y/y to 48,804 units.
- Similar declines were witnessed in the truck and bus segments: 49% y/y to 54,356 units and 77.3% y/y to 2,321 units, respectively. In January-May, Japanese vehicle production declined by 25.4% y/y to just under 3.1 million units.
- Output in the passenger car category reached 2.6 million units during this period, down 25.8% y/y, while truck production declined by 22.8% y/y to 414,082 units and bus output fell by 22.2% y/y to 37,178 units.
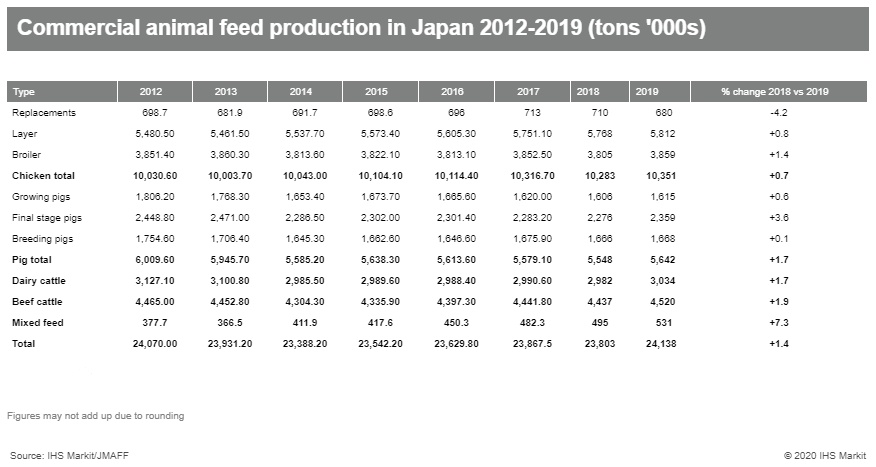
- Japan's production of commercial animal feed increased by 1.4%
in 2019. The Japanese Ministry of Agriculture, Forestry and
Fisheries (JMAFF) reported around 24.1 million tons of commercial
animal feed production took place in fiscal 2019 (ended March 31,
2020). In 2019, chicken feed production rose by 0.7% to 10.3
million tons. This segment was aided by the lack of any serious
diseases such as avian influenza in Japan during 2019. Pig feed
production increased by 1.7% to 5.6 million tons. This was despite
48 cases of classical swine fever (CSF) in several areas of Japan
over the course of the year. Dairy and beef cattle feed production
went up by 1.7% and 1.9% to three million tons and 4.5 million
tons, respectively. Last year, the Japanese commercial feed sector
saw a decline in production. This was the first annual drop after
three consecutive years of increases. However, growth has been slow
over the last seven years. The table below shows feed production
was only up 0.3% between 2012 and 2019. (IHS Markit Animal Health's
Dr Atsuo Hata)
- Mazda has reported its financial results for first quarter
(ended 30 June 2020) of the fiscal year (FY) 2020/21, recording a
net loss of JPY66.7 billion (USD635 million). (IHS Markit
AutoIntelligence's Abby Chun Tu)
- Mazda's net loss during the reporting period between 1 April and 30 June 2020 compares with a net profit of JPY5.24 billion in the corresponding period of the previous year.
- Mazda's operating loss during the first quarter of FY 2020/21 totaled JPY45.3 billion, compared with operating income of JPY7.0 billion in the same period of FY 2019/20.
- Mazda sold 244,000 vehicles during the reporting period, down 30.8% year on year (y/y). The automaker's sales in North America fell by 18.8% y/y to 81,000 units, while sales in Japan fell by 33.9% y/y to 26,000 units.
- Mazda's sales in Europe were hit hard in the reporting period, plunging 58.3% y/y to 28,000 units. China represents the only sales market in which Mazda experienced growth during the reporting period.
- The automaker's sales volumes in the country rose by 13.2% y/y to 61,000 units in the first quarter of FY 2020/21. The automaker expects its global sales volume to fall by 8.4% y/y to 1.3 million units in FY 2020/21.
- China's official manufacturing purchasing managers' index (PMI)
was 51.1 in July, up 0.2 point from June - the fifth consecutive
month above the 50 expansionary threshold since the pandemic
outbreak. (IHS Markit Economist Yating Xu)
- Sentiments improved across production and demand as output sub-index recorded the highest July figure since 2015 and new orders sub-index rose for the third straight month.
- New export orders improved by 5.8 percentage points and imports improved by 2.1 percentage points, although both were still below the expansionary threshold.
- Sub-index of purchased material prices continued to rise with oil price recovery.
- Sub-index of finished goods stocks rose again following two consecutive months of decline.
- By sector, production PMI expanded in all 21 surveyed manufacturing sectors except persistent contraction in the chemical sector. Textile and lumber manufacturing reported the first expansion since February. From the demand side, manufacturing of paper and printing, electrical machinery, and computers led the recovery.
- Manufacturing PMI showed continuous divergency in different scale of enterprises with large and medium-sized firms leading the recovery while sentiment in small firms further deteriorated.
- China's non-manufacturing PMI edged down by 0.2 point to 54.2 in July, entirely owing to the slowdown in services, while construction accelerated.
- Construction PMI rose by 0.7 point to 60.5 in July and the construction employment and expectation index stayed above 55 for four straight months.
- Service PMI declined by 0.3 points to 53.1 as new orders and employment weakens.
- The good news was that household services and culture and entertainment returned to expansion for the first time since February under a series of consumption-driven policies across the country.
- The composite output PMI, covering both manufacturing and non-manufacturing sectors, came in at 54.1, down from 0.1 point from the previous reading.
- Thailand's industrial production, on a seasonally adjusted
basis, rose by 5.7% month on month in June, which softened the
year-on-year (y/y) contraction to 17.8%, from 23.5% y/y in May. The
improvement largely reflected softer contractions in production of
motor vehicles, electrical equipment, and coke and refined
petroleum products. (IHS Markit Economist Harumi Taguchi)
- The increase in production was thanks to improved domestic demand in line with easing COVID-19 containment measures. A rise in sales of commercial and passenger cars contributed to a recovery in production of motor vehicles.
- The private consumption index suggests only a modest recovery of private consumption in the second quarter, largely because of sluggish spending on durables and services.
- Thailand's exports declined at a faster pace in June, recording a 24.6% y/y decrease, while the contraction of imports softened to 18.2% y/y, from a 34.2% y/y drop in May.
- Although Thailand's exports to China and the United States rose 12.2% y/y and 14.7% y/y, respectively, exports to Association of Southeast Asian Nations (ASEAN) countries, the European Union, and Japan remained sluggish.
S&P Global provides industry-leading data, software and technology platforms and managed services to tackle some of the most difficult challenges in financial markets. We help our customers better understand complicated markets, reduce risk, operate more efficiently and comply with financial regulation.
This article was published by S&P Global Market Intelligence and not by S&P Global Ratings, which is a separately managed division of S&P Global.
{"items" : [
{"name":"share","enabled":true,"desc":"<strong>Share</strong>","mobdesc":"Share","options":[ {"name":"facebook","url":"https://www.facebook.com/sharer.php?u=http%3a%2f%2fstage.www.spglobal.com%2fmarketintelligence%2fen%2fmi%2fresearch-analysis%2fdaily-global-market-summary-31-july-2020.html","enabled":true},{"name":"twitter","url":"https://twitter.com/intent/tweet?url=http%3a%2f%2fstage.www.spglobal.com%2fmarketintelligence%2fen%2fmi%2fresearch-analysis%2fdaily-global-market-summary-31-july-2020.html&text=Daily+Global+Market+Summary+-+31+July+2020+%7c+S%26P+Global+","enabled":true},{"name":"linkedin","url":"https://www.linkedin.com/sharing/share-offsite/?url=http%3a%2f%2fstage.www.spglobal.com%2fmarketintelligence%2fen%2fmi%2fresearch-analysis%2fdaily-global-market-summary-31-july-2020.html","enabled":true},{"name":"email","url":"?subject=Daily Global Market Summary - 31 July 2020 | S&P Global &body=http%3a%2f%2fstage.www.spglobal.com%2fmarketintelligence%2fen%2fmi%2fresearch-analysis%2fdaily-global-market-summary-31-july-2020.html","enabled":true},{"name":"whatsapp","url":"https://api.whatsapp.com/send?text=Daily+Global+Market+Summary+-+31+July+2020+%7c+S%26P+Global+ http%3a%2f%2fstage.www.spglobal.com%2fmarketintelligence%2fen%2fmi%2fresearch-analysis%2fdaily-global-market-summary-31-july-2020.html","enabled":true}]}, {"name":"rtt","enabled":true,"mobdesc":"Top"}
]}


