Customer Logins
Obtain the data you need to make the most informed decisions by accessing our extensive portfolio of information, analytics, and expertise. Sign in to the product or service center of your choice.
Customer Logins
ECONOMICS COMMENTARY
Jun 14, 2019
Falling industrial production confirms Eurozone PMI downturn signal
- Official data show industrial production dropping 0.5% in April with manufacturing output down 0.8%
- Volatility in the official data makes signal-reading hard, but PMI provides additional cause for concern with downturn extending into May
Industrial production in the euro area fell in April, adding to worries about the economic health of the region in the second quarter. More up to date PMI survey data suggest the downturn continued into May.
Disappointing start to second quarter
The latest official data showed industrial production dropping 0.5% in April after a 0.4% decline in March. The narrower gauge of manufacturing output showed an even steeper decline, dropping 0.8% in April after a 0.2% slide in March.
Caution is needed in interpreting the data as the monthly numbers are volatile. For example, January saw manufacturing output surge 1.7%, reviving after sharp declines in both the final two months of 2018. Does the latest downturn really indicate a weakening of the manufacturing sector or might we see the data rebound again in May and June, just as we saw at the start of the year? The question is especially important for monetary policymakers. The ECB is poised to implement more stimulus if the economy needs it.
Determining the trend
This is where the PMI survey data can help. While the official data can be volatile, the IHS Markit Eurozone PMI® data tend to provide a smoother guide to the underlying trend.
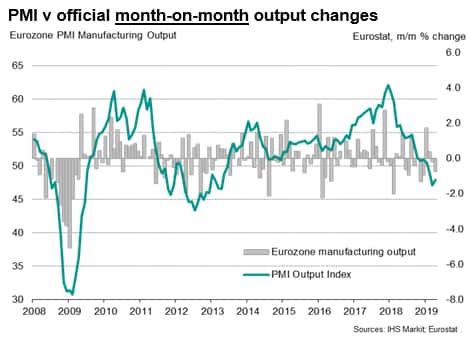
Our first chart shows the PMI survey manufacturing output index tracked against month-on-month changes in the official output data. The chart reveals just how difficult it is to glean any idea of the trend in production from the official data.
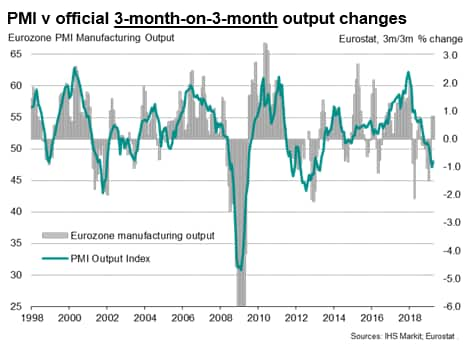
A common solution to removing some of this volatility is to look at three-month-on-three-month changes in the official data, as shown in our second chart and again overlaid with the PMI output index.
However, even using this measure, the official data are clearly still volatile and can send very different messages to policymakers within a short space of time. For example, in early 2018, the three-month growth rate went from +2.2% to -2.1% and then back to +0.8% within just seven months. For a central bank, such as the ECB, advocating that policy will be 'data dependent', such volatility creates a headache.
The three-month growth rate also inherently contains lagged information. Most recently, the three-month growth rate held at +0.8% in April 2019 despite the 0.8% month-on-month drop in April.
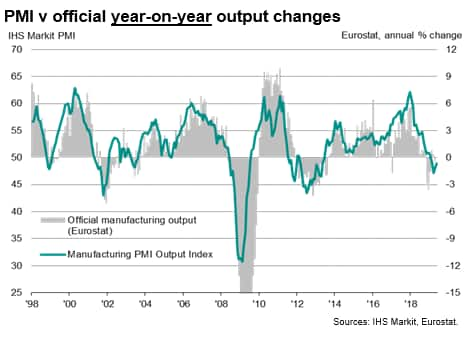
Even the year-on-year growth rate can show undue volatility (see third chart) which can confuse the policy signal.
However, what's common to all three charts is the way in which the PMI tends to cut though the noise of the official data and provides a reliable guide to the underlying production trend. For example, it appears that a contraction of output signalled by the three-month-on-three-month growth rate always gets reversed quickly if the PMI remained above 50. This is likely due to the official data having been influenced by a major change in one industry (often autos or pharmaceuticals) due to special factors rather than reflecting a broad weakening of the economy.
Cutting through the noise
What does the PMI tell us about the recent trend in manufacturing?
First, the PMI indicated that the steep drop in production late last year, which pushed the annual rate of growth down to -3.6%, likely overstated the weakness of the goods producing sector as a whole at that time. This probably reflected one-off factors such as the auto sector grappling with new emission testing regulations. However, note that the PMI was saying that the manufacturing sector was undergoing a slowdown, just not a contraction (yet).
Second, the subsequent strong revival in manufacturing seen in the official data early this year was a rebound from the weakness seen late last year and hence gave a 'false' signal of revitalised health.
Third, more recently, the weakening of the official data in March and April looks broadly in line with the PMI, which suggests that we can have more confidence in the data signal that manufacturing is indeed struggling. This pattern of decline appears to have extended into May, with the PMI's output index running below the 50.0 no change level for the fourth successive month. Some consolation can be gleaned, however, by the index having risen for a second successive month, pointing to an easing in the rate of decline.
Flash PMI data for June are published on 21st June, which will provide guidance on whether the rate of decline has continued to ease or whether the downturn has accelerated again amid intensifying global trade tensions.
Chris Williamson, Chief Business Economist, IHS Markit
Tel: +44 207 260 2329
chris.williamson@ihsmarkit.com
© 2019, IHS Markit Inc. All rights reserved. Reproduction in whole
or in part without permission is prohibited.
Purchasing Managers' Index™ (PMI™) data are compiled by IHS Markit for more than 40 economies worldwide. The monthly data are derived from surveys of senior executives at private sector companies, and are available only via subscription. The PMI dataset features a headline number, which indicates the overall health of an economy, and sub-indices, which provide insights into other key economic drivers such as GDP, inflation, exports, capacity utilization, employment and inventories. The PMI data are used by financial and corporate professionals to better understand where economies and markets are headed, and to uncover opportunities.
This article was published by S&P Global Market Intelligence and not by S&P Global Ratings, which is a separately managed division of S&P Global.
{"items" : [
{"name":"share","enabled":true,"desc":"<strong>Share</strong>","mobdesc":"Share","options":[ {"name":"facebook","url":"https://www.facebook.com/sharer.php?u=http%3a%2f%2fstage.www.spglobal.com%2fmarketintelligence%2fen%2fmi%2fresearch-analysis%2feurozone-industrial-production-falls-at-start-of-second-quarter.html","enabled":true},{"name":"twitter","url":"https://twitter.com/intent/tweet?url=http%3a%2f%2fstage.www.spglobal.com%2fmarketintelligence%2fen%2fmi%2fresearch-analysis%2feurozone-industrial-production-falls-at-start-of-second-quarter.html&text=Falling+industrial+production+confirms+Eurozone+PMI+downturn+signal+%7c+S%26P+Global+","enabled":true},{"name":"linkedin","url":"https://www.linkedin.com/sharing/share-offsite/?url=http%3a%2f%2fstage.www.spglobal.com%2fmarketintelligence%2fen%2fmi%2fresearch-analysis%2feurozone-industrial-production-falls-at-start-of-second-quarter.html","enabled":true},{"name":"email","url":"?subject=Falling industrial production confirms Eurozone PMI downturn signal | S&P Global &body=http%3a%2f%2fstage.www.spglobal.com%2fmarketintelligence%2fen%2fmi%2fresearch-analysis%2feurozone-industrial-production-falls-at-start-of-second-quarter.html","enabled":true},{"name":"whatsapp","url":"https://api.whatsapp.com/send?text=Falling+industrial+production+confirms+Eurozone+PMI+downturn+signal+%7c+S%26P+Global+ http%3a%2f%2fstage.www.spglobal.com%2fmarketintelligence%2fen%2fmi%2fresearch-analysis%2feurozone-industrial-production-falls-at-start-of-second-quarter.html","enabled":true}]}, {"name":"rtt","enabled":true,"mobdesc":"Top"}
]}


