Customer Logins
Obtain the data you need to make the most informed decisions by accessing our extensive portfolio of information, analytics, and expertise. Sign in to the product or service center of your choice.
Customer Logins
BLOG
Mar 10, 2020
IHS Markit Fair Value Case Study
IHS Markit Fair Value in Review
The last week of February 2020 was the worst for global markets since 2008, as all three major US benchmarks - Dow Jones, S&P 500, and NASDAQ - dropped more than 10%. With the majority of the initial coronavirus cases limited to China, global stock market pricing did not see an immediate negative impact However, as the epidemic spread to as many as 30 countries and as the total number of cases increased rapidly, worldwide markets plummeted.
Growing anxiety around the impact of coronavirus on businesses and economies triggered a flight to safety causing significant volatility. During the week of February 24, markets across the globe had noticeable overnight movements that were captured by IHS Markit's fair value prices. Extreme volatility continues to reinforce the need for updated fair value prices to accurately calculate net asset value (NAV) of portfolios with international exposure.
IHS Markit Fair Value Results
During the week of February 24, IHS Markit continued to provide fair value prices for over 30,000 securities using a patent-pending multi-factor methodology. Global, regional, sector, and entity-specific factors were used to reflect macro and micro level risks. Table 1 highlights accuracy statistics for IHS Markit's entire equity universe during the week showcasing the significant overnight movement captured (Arbitrage Reduction) across APAC, EMEA (FV as of 4 PM EST) and US (FV as of 12 PM GMT).

The Week in Aggregate
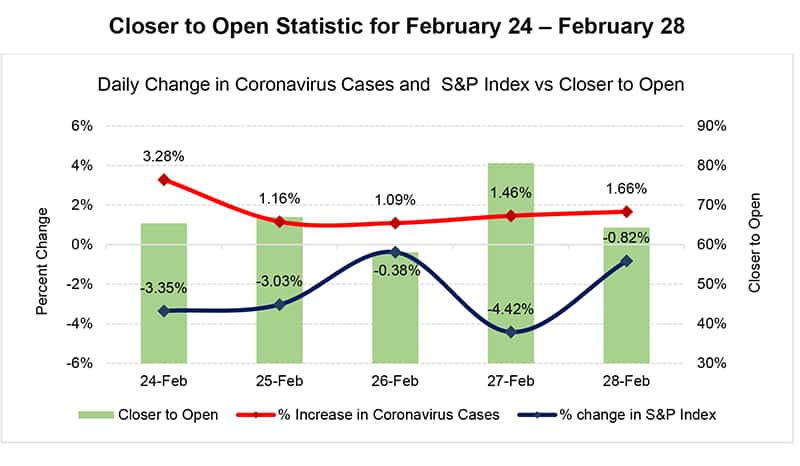
As the number of new coronavirus cases increased during the week of
February 24, the drop in the S&P 500 Index increased as well.
Table 2 visualizes how the spread of information affected the
S&P 500 Index and the accuracy of the fair valuation for entire
equity universe (APAC, EMEA and US) versus next day's market
open.

Capturing movement on Japan holiday for Emperor's
Birthday - February 24
The Japanese markets were closed on February 24 in celebration of
the Emperor's Birthday. During the preceding weekend, CDC reports
stated that the virus had spread to 30 countries around the world
with Japan at the center of the surging number of cases. This
information exacerbated fears of a pandemic leading to a drop of
~3.4% in the S&P 500 Index on Monday, kicking off the week of
mayhem. As the Tokyo exchange was closed, investors with Japanese
exposure required fair value prices as the closing prices did not
reflect the weekend news. Our Fair Value models were able to
capture the market's reaction on Monday and were close to the
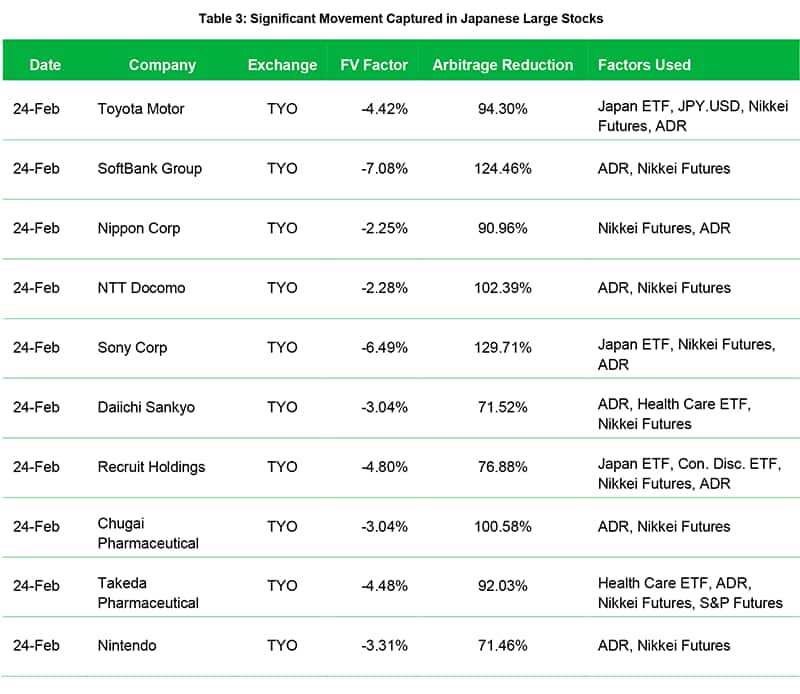
Japanese market's open on Tuesday. Table 2 and 3 highlight our
overall results as well as significant overnight movement captured
(Arbitrage Reduction) for some Japanese Large Cap firms as of 4 PM
EST on Monday, February 24 respectively.


Similarly, firms are increasingly looking to leverage FV equities pricing as the market data input into equity derivative valuations. Using the same underlying market data as is used to set net asset values for cash holdings, allows the true basis risk to be reflected vs. any market noise particularly pronounced in volatile markets. Subsequent case studies will present the impact of using FV pricing as a market data input on equity derivatives.
Worst day of the Week Confirming Market Correction -
February 27
On February 27, news of an increasing number of Coronavirus cases
during US hours worsened fears of significant global supply chain
interruptions. This resulted in the largest day of selloffs during
the week with all three major US benchmarks closing more than 4%
down. The next day, 18,500 foreign securities opened 2.5% lower on
average.
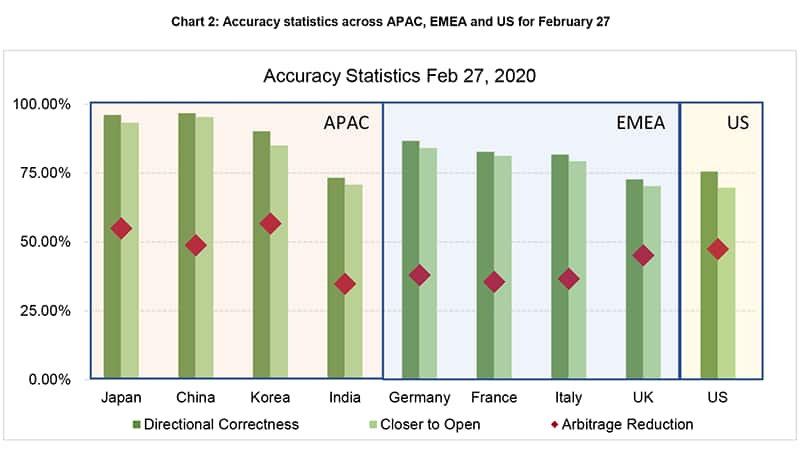
Chart 2 demonstrates the effectiveness of our Fair Value model on
February 27 highlighting the high degree of directional
correctness, closer to open, and arbitrage reduction for nine of
the world's largest economies (for APAC and EMEA countries, FV as
of 4 PM EST and for US, FV as of 12 PM GMT).

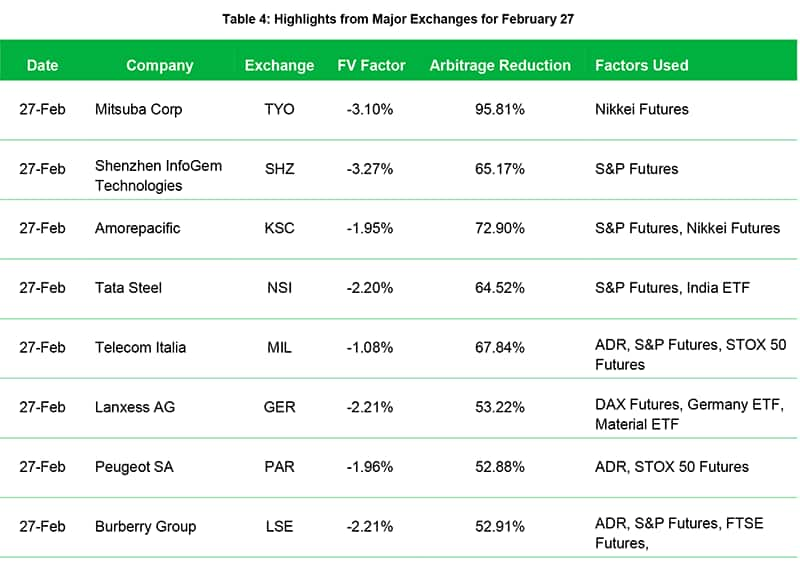
Table 4 provides further insight into our performance on February 27, showcasing our model's ability to capture significant movement in individual securities.

IHS Markit's Fair Value service helps clients meet their regulatory and compliance requirements by providing daily fair value adjustment factors and prices for over 150,000 equity and fixed income securities. We provide security-level as well as aggregate-level fair value adjustment factors across global hourly snaps with the ability to add custom snap times tailored to client requests. To learn more, please visit: ihsmarkit.com/products/pricing-data-fair-value.html or contact: MK-FixedIncomePricingBusinessDevelopment@ihsmarkit.com.
Appendix
Actual Overnight Return: The return of a
security from its last close to its next open, regardless of how
long the time gap may be.
Directional Correctness: occurs when a fair value
price is in the same direction (+, -) as the actual overnight
return of the underlying security. The values present in the
document are the proportion of securities within a group that were
directionally correct.
Closer to Open: whether a fair value price is
closer to the next day open than the previous close. The values
present in the document are the proportion of securities within a
group that were closer to open.
Arbitrage Reduction: the amount of the movement in
the underlying security that we captured using our Fair Value
price. These values can be positive or negative, with 100% being
full capture. For tables 1 and 2, the values are the average
arbitrage reduction across the group.
Market Cap Calculations: To represent components
of an index we use shares outstanding multiplied by either the
close, fair value, or open price of a security. The result of this
is an individual security's market cap at a given time. The sum of
the securities' market caps within each index gives the total
market cap at a given time. Domestic currencies are used for all
calculations.
S&P Global provides industry-leading data, software and technology platforms and managed services to tackle some of the most difficult challenges in financial markets. We help our customers better understand complicated markets, reduce risk, operate more efficiently and comply with financial regulation.
This article was published by S&P Global Market Intelligence and not by S&P Global Ratings, which is a separately managed division of S&P Global.
{"items" : [
{"name":"share","enabled":true,"desc":"<strong>Share</strong>","mobdesc":"Share","options":[ {"name":"facebook","url":"https://www.facebook.com/sharer.php?u=http%3a%2f%2fstage.www.spglobal.com%2fmarketintelligence%2fen%2fmi%2fresearch-analysis%2ffair-value-case-study-coronavirus-market-shocks.html","enabled":true},{"name":"twitter","url":"https://twitter.com/intent/tweet?url=http%3a%2f%2fstage.www.spglobal.com%2fmarketintelligence%2fen%2fmi%2fresearch-analysis%2ffair-value-case-study-coronavirus-market-shocks.html&text=S%26P+Global+Fair+Value+Case+Study++%7c+S%26P+Global+","enabled":true},{"name":"linkedin","url":"https://www.linkedin.com/sharing/share-offsite/?url=http%3a%2f%2fstage.www.spglobal.com%2fmarketintelligence%2fen%2fmi%2fresearch-analysis%2ffair-value-case-study-coronavirus-market-shocks.html","enabled":true},{"name":"email","url":"?subject=S&P Global Fair Value Case Study | S&P Global &body=http%3a%2f%2fstage.www.spglobal.com%2fmarketintelligence%2fen%2fmi%2fresearch-analysis%2ffair-value-case-study-coronavirus-market-shocks.html","enabled":true},{"name":"whatsapp","url":"https://api.whatsapp.com/send?text=S%26P+Global+Fair+Value+Case+Study++%7c+S%26P+Global+ http%3a%2f%2fstage.www.spglobal.com%2fmarketintelligence%2fen%2fmi%2fresearch-analysis%2ffair-value-case-study-coronavirus-market-shocks.html","enabled":true}]}, {"name":"rtt","enabled":true,"mobdesc":"Top"}
]}


