Customer Logins
Obtain the data you need to make the most informed decisions by accessing our extensive portfolio of information, analytics, and expertise. Sign in to the product or service center of your choice.
Customer Logins
BLOG
May 05, 2021
Festival, Favour and Freight: Global Rose Trade
Many cultures around the world are expecting Mothers' Day in the coming weekend. A typical gift on days like this is a bundle of roses. A rose is symbolic enchantment in many occasions. Apart from major events, it is also a common ornament for daily life and business. In developing markets, with improvement of people's life, consumers may start to pursue for specialty flower species imported from overseas. Thanks to the development of logistics services - cold chain, airfreight for example, time-sensitive products, such as flowers now become accessible to consumers in another sphere of the earth too.
Unlike raw materials or industrial products that in many cases are with complex value chains and influential factors for trade would involve many upstream and downstream players, the fresh flower trade is more consumer-demand (e.g. taste, culture, lifestyle etc.) driven, and the availability is impacted by high-quality logistics services. By zooming into trade statistics on a specific item (HS 060311, fresh cut roses and buds), we examine the different markets peak seasons and the trend in terms of rose trade, also the dynamic of global wide trade patterns, as well as the impact from logistics disrupts that may damage certain market's trade and economy.
Implication
Understand Consumer Markets: as seasonality shows, some peak trade timepoints are universal to importing region while each market captures some patterns that are specific to a country or regions' culture; yet could be evolving with time. The underlying driving factors could be complex and not straightforward or definable, yet de-facto trade data could give a way to understand these developments, such as consumption preference or cultural features, which could become the ultimate source of trade.
Capture Supply Chain Dynamic: with higher logistics connectivity and advanced freight services, along with border clearance measures, some traditional supply chain modes/trade patterns may be gradually shifting, as could be observed in the case of Netherlands's import and export trade of flowers and its position as a trade hub. In addition, the structure and diversity/concentration of import/export partners would make the trade outcome differentiated under certain disrupts or stimulus events.
Address Logistics & Facilitation Need: increasing demand for fresh/perishable products means the need for expansion of freight services, such as air connectivity and warehouses (routes, capacity), or expedited border measures. Disruption or insufficiency of such infrastructure could damage the trade flow especially for emerging markets. Trade data could reveal the opportunities to enter or invest in less developed but promising markets.
Global Rose Trade
The international rose trade market amounted to USD 8.63 billion in 2019, the number dropped to 4.58 billion in 2020 - largely due to transport disrupts. The natural characteristics and growing condition requirements highlight the ultimate sources of roses are in those located near the earth's equator. This is reflected in a quick snapshot on the global trade flow as shown in Figure 1. Key exporting countries are Kenya, Ethiopia in Africa; Colombia and Ecuador in Latin America; with Netherlands as a marketplace for both imports and exports; import markets are mostly the developed countries that have a taste for flower consumption.
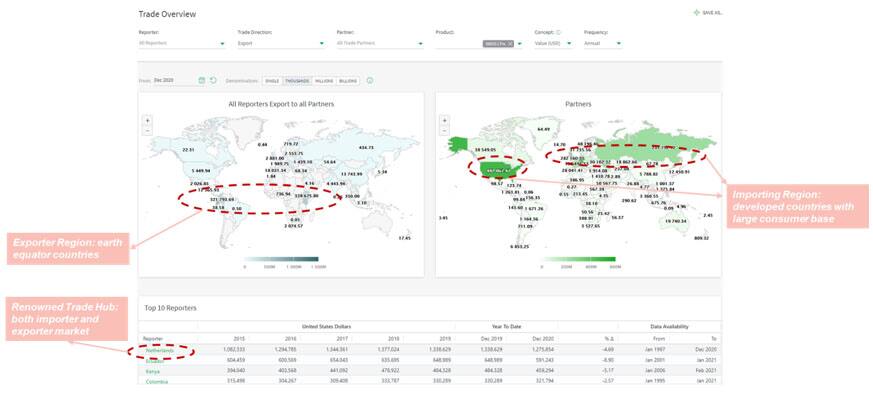
Figure 1: Rose (HS 060311) Trade Worldwide Overview (Source: IHS Markit Global Trade Atlas)
Consumer Markets: United States Steady Growth with Festival Stimulus
U.S. import volume is relatively steady and grows steadily in the past decade, from 1.48 billion to 2.04 bilion in 2020, with a CAGR of 3.6%. Imported roses are mostly from nearby Latin American Countries notably Colombia and Ecuador. The two countries account for 65% and 32% of total U.S. rose imports respectively.
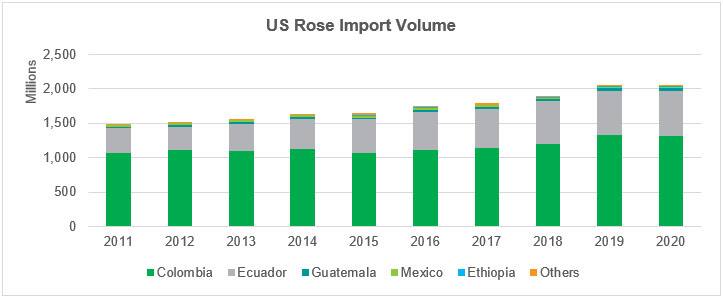
Figure 2: U.S. Import Origin and Trend (Source: IHS Markit Global Trade Atlas)
The monthly series has demonstrated two obvious seasonal highs, January to February and April to May, when the two rose-giving days are celebrated (Valentines' and Mother's Day). Taking 2020 for example, the four months (January, February, April and May) together contribute 907 million roses - about 45% of the total for the year.
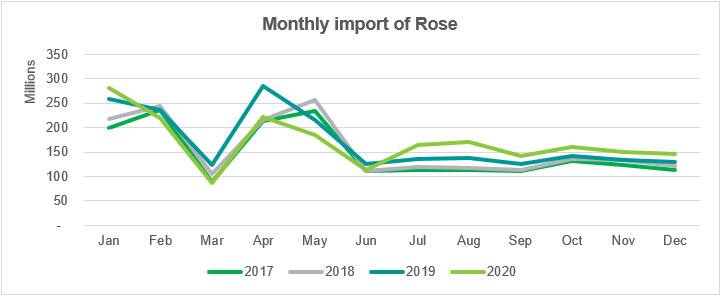
Figure 3: U.S. Import Seasonality (Source: IHS Markit Global Trade Atlas)
If looking at the import location - mostly via air and into Miami, which consistently accounts for over 90% of U.S. total imports, not only owing to the adjacency of Miami and air connectivity to these countries, but also with dedicated facilitation in place, such as the Cargo Clearance Centre and Miami Plant Protection Quarantine Inspection Station, to ensure the fresh cut roses inbound freight processing and distribution on a timely manner.
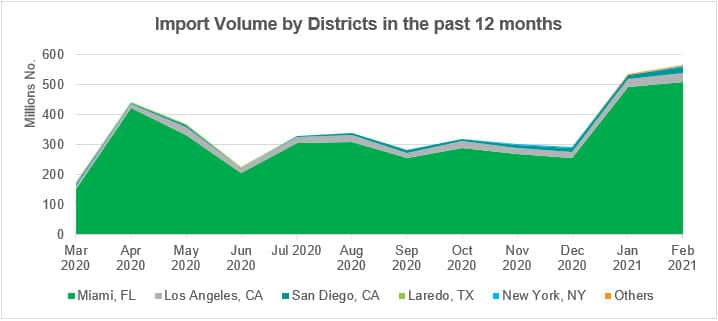
Figure 4: U.S. Major Importing District (Source: IHS Markit Global Trade Atlas)
China: Expanding consumption
Though domestically planted in southwest provinces as well, China's rose imports increased significantly in the past decade. The volume has grown from merely 17.6 tonnes to circa 900 tonnes in 2019, though last year trade is damaged partially caused by lock-down and international flight reductions, which highlights the impact by air connectivity on this trade flow. The growth is likely to have been driven by several factors, including the increasing middle-class or young generation consumer base that look for more versatile flowers, the facilitation of fresh products import trade and the airfreight and cold chain logistics network service, to name a few.
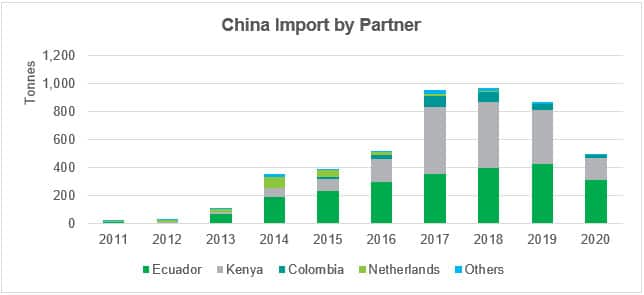
Figure 5: China Import Origin and Trend (Source: IHS Markit Global Trade Atlas)
The import partners show a different picture than the U.S. market, i.e. a combination of Latin America and African countries are being sourced from, with Ecuador and Kenya being the two largest suppliers. Long-haul flights are required from either region before arriving in the far-east.
By looking at monthly series, the consumption indicates some festival stimulus but different patterns - as for local culture and traditions, together with the introduction western culture and modern lifestyle. February when Chinese Spring Festival and Valentine's Day from western culture twining together pushing the import to a high point; August became the paramount season - it's when Chinese Valentines' Day or Qi Xi (July 7 in Lunar Calendar). Mothers' day though not a tradition in China but with culture exchange, it is emerging as another peak for rose demand.
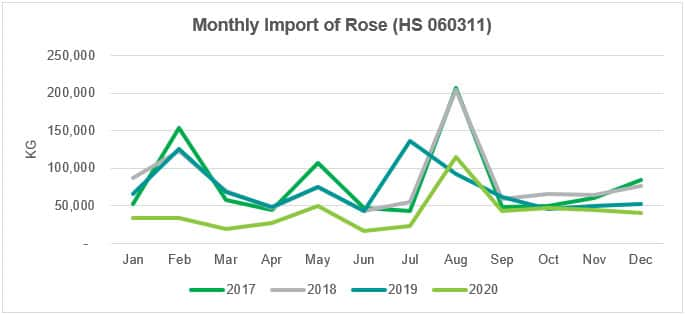
Figure 6: China Import Seasonality (Source: IHS Markit Global Trade Atlas)
The distribution of importing provinces reflects the consumer markets as well. Shanghai, Beijing and Guangdong account for 90% of total China's import of fresh roses. Apart from traditional festivals, daily ornament and decoration are becoming more popular in these large cities that pushes up demand for quality and diversity. Likewise, higher level of air connectivity i.e large international airports and logistics capability in these metropolitans are supporting the time and temperature sensitive demand to be met.
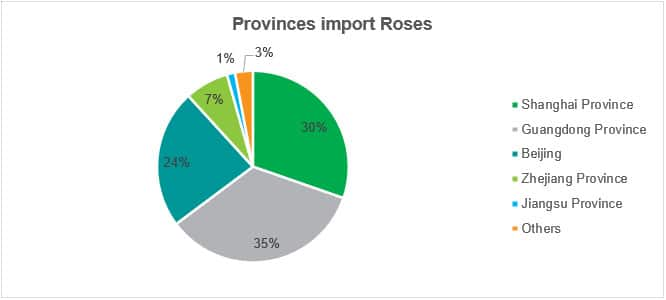
Figure 7: Importing Province in 2020 (Source: IHS Markit Global Trade Atlas)
European Union and UK: Year-round Taste
In general, EU imports from external shows a similar pattern with the UK, in terms of growth, origins and seasonality. Rose imports to the EU and UK are relatively stable and year-on-year change is not significant, peaking in 2016 at 258,378 and 15,018 tonnes respectively; after the import for both markets seems slight contracted in recent years, prior to a significant drop in 2020 when disrupts from air connectivity loss is obvious - reducing the import to 200,595 and 11,042 tonnes.
African origins are the major supplying markets for the EU and UK. Though Kenya remain the top one for both markets; it's also noticeable that imports from Ethiopia are on a continuous growth trend in recent years, or actually has a degree of substitution effect against trade from Kenya.
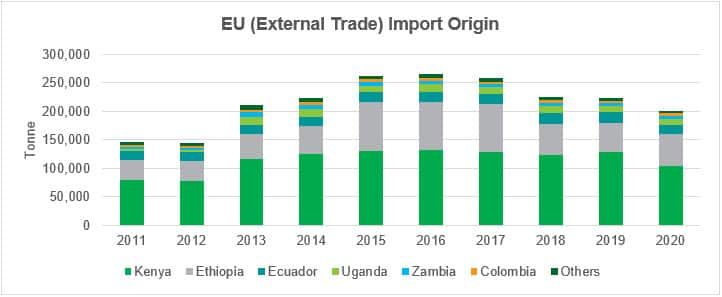
Figure 8: EU Import Volume by Partner (Source: IHS Markit Global Trade Atlas)
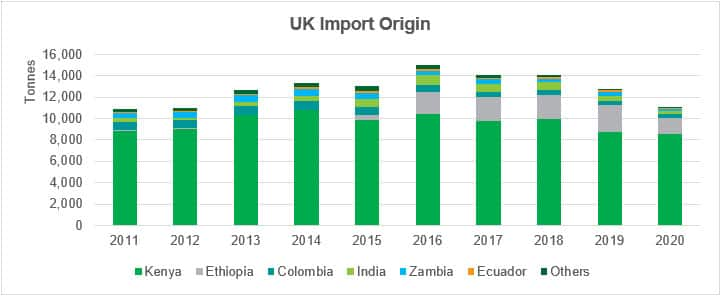
Figure 9: UK import volume by partner (Source: IHS Markit Global Trade Atlas)
Monthly statistics has indicated a pattern with more evenly distributed flows throughout the year comparing to China's market, could be resulted from more daily consumption need in European life.
Yet there's still some interesting differences. There seems to be higher seasons which could possibly owe to individual member states' specific festival and consumption habits; also another reason would that Netherlands acting as the flower hub, will relay the rose delivery and distribute to other final consumer markets could result in year-round imports.
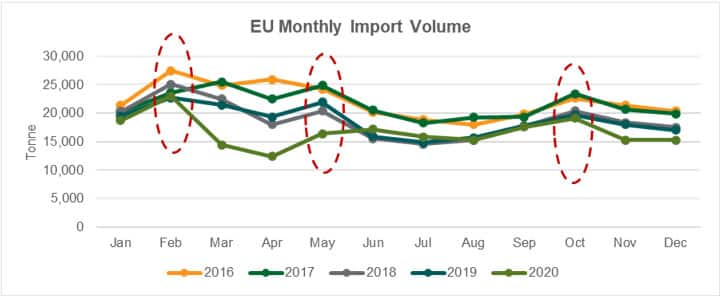
Figure 10: EU Monthly Import of Roses (Source: IHS Markit Global Trade Atlas)
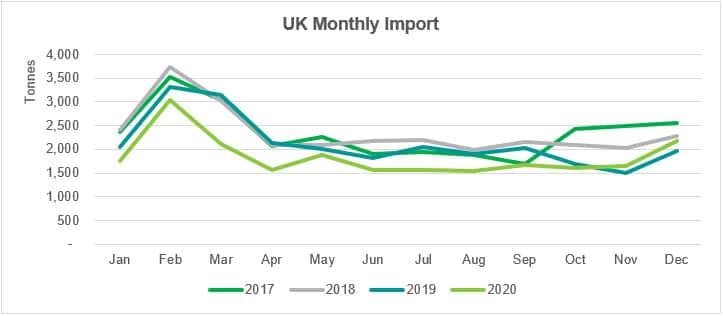
Figure 11: UK Monthly import of Roses (Source: IHS Markit Global Trade Atlas)
Trade Pattern: Netherlands Marketplace Position
Netherlands as the famous flower marketplace, both import and export large volumes of roses full-year facilitated by its auction markets and flower related industry. While Netherlands rose trade volume remains in deficit, trade value has always been in surplus. This could mean that as a world trade hub, Netherlands operations involve value added elements and processing the flowers.
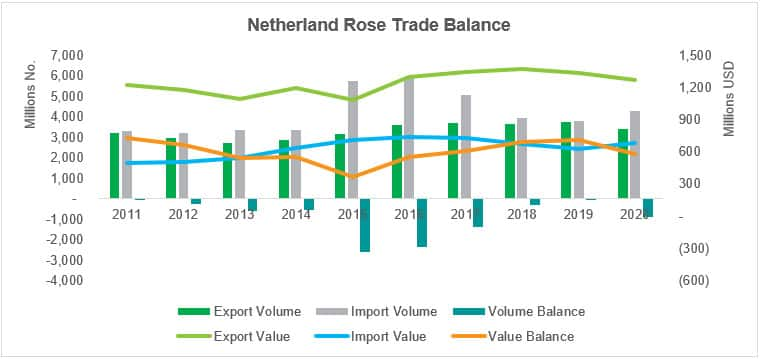
Figure 12: Netherlands Rose Trade Balance (Source: IHS Markit Global Trade Atlas)
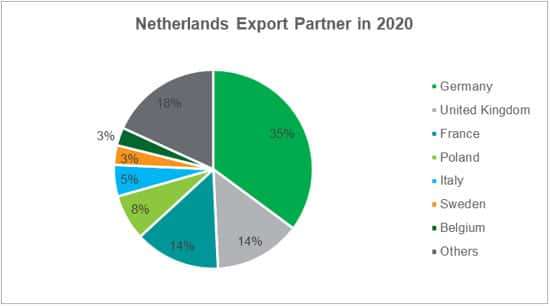
Figure 13: Netherlands Export Destination (Source: IHS Markit Global Trade Atlas)
At the same time, Ethiopia is expanding as a strong supplier of Netherlands' imports of roses. The destination of Netherlands exports are mostly European countries that are reachable with short-journey flights or even delivered via road/rail. This 'Long-distance sourcing, adjacent sales markets' trade pattern will be triggering both land transport and air freight.
However, Netherlands' imports have been in decline for a consecutive four years (except 2020 which is an abnormal year.). With the direct trade connection between origin countries and final markets, supported by integrated value-added logistics services, importers who used to buy from Netherlands may find an alternative option - to have direct trade relations from source to end-consumer markets.
This may imply that with more advantaged integrated services provided by 3PLs or 4PLs, the role of a 'trade hub' for flower seems to be weakened to a certain degree, as has been noticed 'The introduction of direct flights over the years has resulted in major developments in trade relations between countries such as America, the UK and China.' (Source: BBC Made on Earth - the 4,000 Mile Flower delivery)
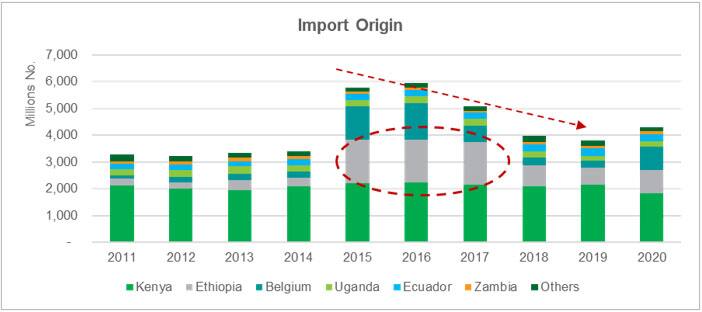
Figure 14: Netherlands Import Origin (Source: IHS Markit Global Trade Atlas)
Supply Chain Continuity
Flowers are typically carried by air because of their perishable nature. According to IATA, "They are often carried using freighters, but those transported in the belly of passenger aircraft In 2020, disruption from COVID-19 has damaged air connectivity have been impacted by the lack of capacity due to the loss of air passenger connectivity. Even though African countries were often less impacted, passenger connectivity as measured by the IATA connectivity index fell by roughly 40% in Kenya and 30% in Ethiopia in October year-on-year. This was further compounded by lockdowns in some of the main importers, which have reduced the demand for cut flowers." (Source: IATA Air Connectivity)
With trade data we can drill down to see under the same disruption, whether the impacts are even. From the above, we have apparently seen that the key exporting countries are those located close to earth equator. Flowers from African exporters travel long-distance to European and Asian markets. Netherlands and the United Kingdom has imported 53% and 17% of Kenya's total roses. Recovery started from the second half of 2020 with its major export destinations relaxing travel restrictions but the whole year still sees negative growth.
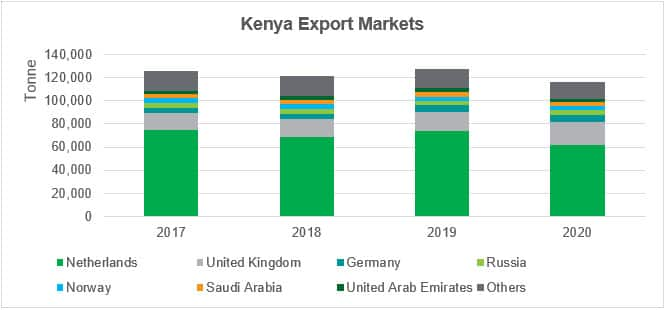
Figure 15: Kenya Export Destinations (Source: IHS Markit Global Trade Atlas)
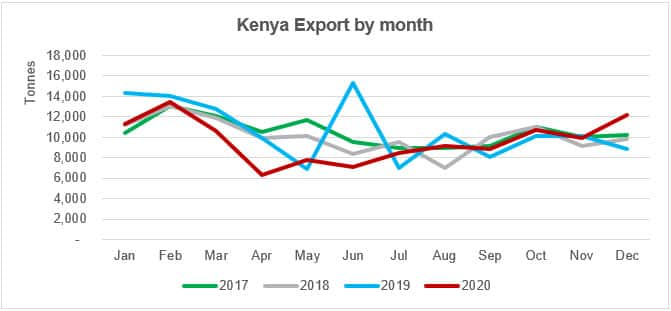
Figure 16: Kenya Monthly Rose Export Volume (Source: IHS Markit Global Trade Atlas)
A less market concentrated example is Ecuador with its destinations spread over North America, Europe and Asia, seems to be experiencing a buffer effect despite a sharp drop in April when first wave of coronavirus hit.
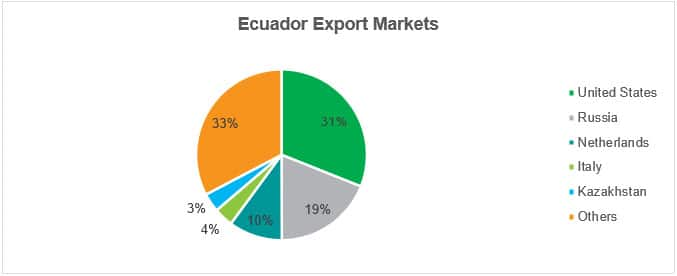
Figure 17: Ecuador Export Markets (Source: IHS Markit Global Trade Atlas)
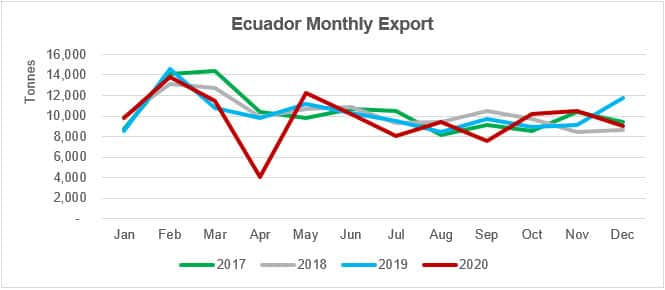
Figure 18: Ecuador Monthly Rose Export Volume (Source: IHS Markit Global Trade Atlas)
Despite the recovery, the negative impact could be particularly significant for those countries with higher dependency on the export of roses. For example, rose is the second and third largest item at 6-digit HS Code level in total export for Kenya and Ethiopia, accounting for 8% and 12% in terms of export trade value.
As said, keeping the global supply chain to meet the demand for flowers involves delicately balanced supply chain of producers, airlines/ships, traders, florists and retailers, thus a combination of factors, for example logistics connectivity re-establishment, the position of particular items in a country's total export, and speed of recovery in destination markets demand, could together have an impact on the degree how a country's total export, employment and economy is hit under disruption events like COVID-19.
Subscribe to our monthly newsletter and stay up-to-date with our latest analytics
{"items" : [
{"name":"share","enabled":true,"desc":"<strong>Share</strong>","mobdesc":"Share","options":[ {"name":"facebook","url":"https://www.facebook.com/sharer.php?u=http%3a%2f%2fstage.www.spglobal.com%2fmarketintelligence%2fen%2fmi%2fresearch-analysis%2ffestival-favour-and-freight-global-rose-trade.html","enabled":true},{"name":"twitter","url":"https://twitter.com/intent/tweet?url=http%3a%2f%2fstage.www.spglobal.com%2fmarketintelligence%2fen%2fmi%2fresearch-analysis%2ffestival-favour-and-freight-global-rose-trade.html&text=Festival%2c+Favour+and+Freight%3a+Global+Rose+Trade+%7c+S%26P+Global+","enabled":true},{"name":"linkedin","url":"https://www.linkedin.com/sharing/share-offsite/?url=http%3a%2f%2fstage.www.spglobal.com%2fmarketintelligence%2fen%2fmi%2fresearch-analysis%2ffestival-favour-and-freight-global-rose-trade.html","enabled":true},{"name":"email","url":"?subject=Festival, Favour and Freight: Global Rose Trade | S&P Global &body=http%3a%2f%2fstage.www.spglobal.com%2fmarketintelligence%2fen%2fmi%2fresearch-analysis%2ffestival-favour-and-freight-global-rose-trade.html","enabled":true},{"name":"whatsapp","url":"https://api.whatsapp.com/send?text=Festival%2c+Favour+and+Freight%3a+Global+Rose+Trade+%7c+S%26P+Global+ http%3a%2f%2fstage.www.spglobal.com%2fmarketintelligence%2fen%2fmi%2fresearch-analysis%2ffestival-favour-and-freight-global-rose-trade.html","enabled":true}]}, {"name":"rtt","enabled":true,"mobdesc":"Top"}
]}


