Customer Logins
Obtain the data you need to make the most informed decisions by accessing our extensive portfolio of information, analytics, and expertise. Sign in to the product or service center of your choice.
Customer Logins
ECONOMICS COMMENTARY
Jun 04, 2019
Global manufacturing PMI slides to lowest since 2012
- Global PMI dips to 49.8, lowest since October 2012
- Order books contract, led by export downturn
- Spare capacity takes pressure off prices, but also hits jobs
- Japan and UK join Eurozone in decline, with sharp slowing in US growth also recorded
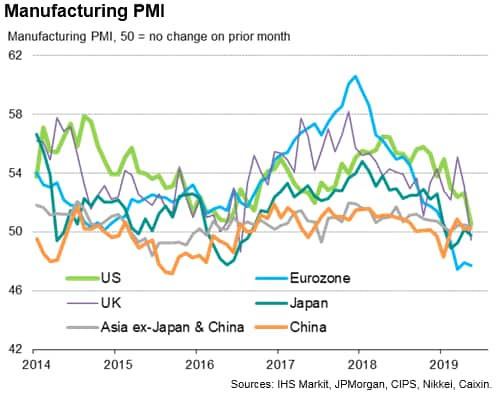
Worldwide PMI surveys indicated that manufacturing moved into decline in May, with business conditions deteriorating to the greatest extent since late-2012 amid an ongoing trade-led slowdown. Economies reporting manufacturing declines now include the Eurozone, UK and Japan although, of the very largest countries, the biggest change was seen in the US, where the PMI fell to its lowest since 2009.
Manufacturing deteriorates
The headline JPMorgan Global Manufacturing PMI, compiled by IHS Markit, fell from 50.4 in April to 49.8 in May, its lowest since October 2012. It was the first time that the PMI has fallen below the 50.0 no change level, indicating an overall deterioration of business conditions (albeit only marginal) since February 2016.
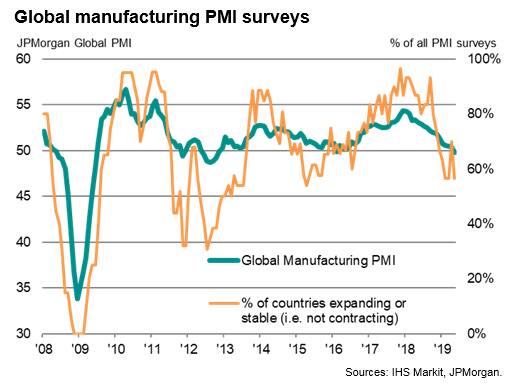
The deterioration contrasts markedly with robust growth indicated this time last year, the PMI having lost ground almost continually since peaking in December 2017.
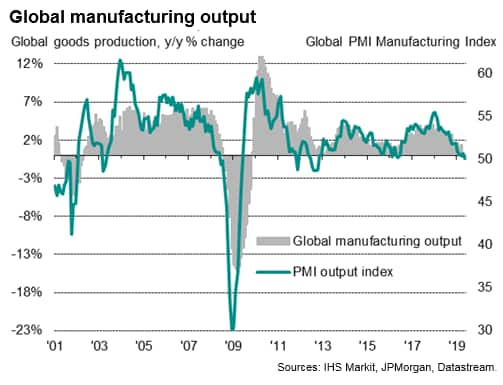
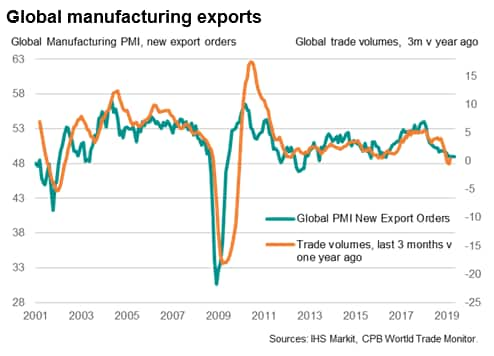
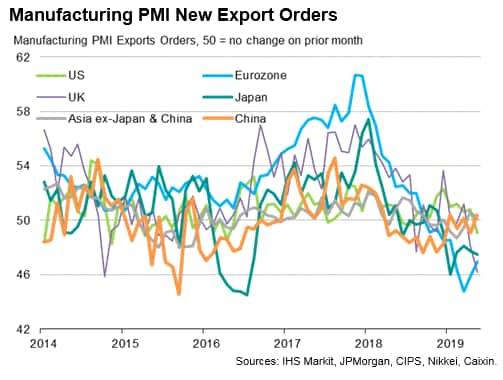
The survey's output and new orders indices both sank to their lowest since October 2012. Falling export orders again fueled the downturn, dropping for a ninth straight month to signal a further deterioration in global trade flows.
The survey data show trade growth having deteriorated from a peak in January 2018, corresponding with rising concerns over trade wars. Anecdotal evidence from the surveys indicated that such concerns intensified again in May. Analysis of comments collected from survey participants revealed an increase in the number of times trade concerns were mentioned to an all-time survey high, pushing future growth expectations to the lowest recorded since outlook data were first collected in mid-2012.
Job cuts and price pressures ease amid signs of spare capacity
The drop in new orders meanwhile meant firms increasingly ate into previously-placed orders to support production. Backlogs of work consequently fell at the joint-fastest rate since December 2012, down for a fifth consecutive month.
Falling backlogs of work hint at the development of spare capacity in the manufacturing sector, a trend which was further indicated by fewer incidences of supply chain delays. This time last year, supply delays hit a seven-year high as suppliers struggled to meet demand. In contrast, in May the number of reported delays was the lowest for three years.
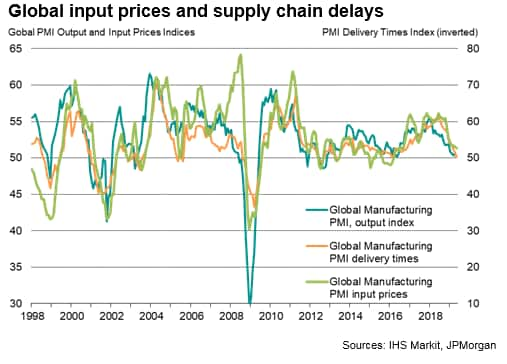
The existence of spare capacity tends to have two consequences.
First, firms typically seek to scale back operations to remove slack, often resulting in job cuts. It was therefore not altogether surprising to see jobs being culled globally in May, albeit only marginally, for the first time in almost three years.
Second, prices tend to come under downward pressure amid spare capacity as firms seek to stimulate weaker than anticipated sales. Such a trend was seen in May, with input costs rising at the slowest pace for nearly three years as more suppliers offered discounts. Average selling prices at the factory gate meanwhile showed the smallest rise since September 2016.
Germany leads the downturn, but the US sees sharp slowdown
The breadth of the slowdown also widened in May, with the number of countries that reported a deterioration or stagnation of manufacturing conditions, defined as a PMI reading at or below 50, rising to 13, up markedly from four this time last year. Germany again reported the steepest downturn, in part reflecting the dominance of auto and machinery makers, both of which are sectors suffering especially weak demand (see our global sector PMI data). The weakness of German production dragged on the eurozone, where the PMI fell to one of the lowest levels seen over the past six years, deep in contraction territory.
Especially steep downturns were also seen in Turkey and the Czech Republic, with more modest (though still substantial) rates of decline seen in Austria, South Korea, Taiwan, Malaysia, Poland, Canada and the UK. Marginal deteriorations were meanwhile seen in Italy, Japan and Russia.
At the other end of the scale, Myanmar and Greece reported the joint-strongest expansion, followed by India, the Netherlands and Vietnam. Of note, six of the top eight performing manufacturing economies were found in the Asia Pacific region. Producers in some countries hinted at benefitting from trade diversion resulting from the US-China trade spat.
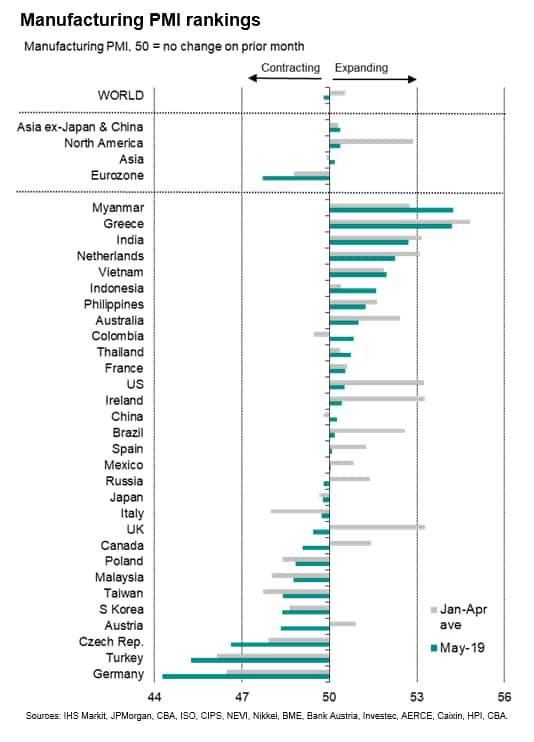
In terms of the biggest movers, the most notable changes were steep drops in PMIs for the US and the UK, down to their lowest levels since September 2009 and July 2016 respectively. While the UK's worsened performance reflected pay-back from Brexit-related stock building earlier in the year (something that was also evident in Ireland), the US's weakened PMI was mainly a reflection of falling orders, notably for export, with export orders falling at the fastest rate for three years.
Of note, although the US PMI came in above the Caixin PMI for mainland China, the US export orders index dropped below that of China for the first time since February 2018.
Chris Williamson, Chief Business Economist, IHS
Markit
Tel: +44 207 260 2329
chris.williamson@ihsmarkit.com
© 2019, IHS Markit Inc. All rights reserved. Reproduction in whole
or in part without permission is prohibited.
Purchasing Managers' Index™ (PMI™) data are compiled by IHS Markit for more than 40 economies worldwide. The monthly data are derived from surveys of senior executives at private sector companies, and are available only via subscription. The PMI dataset features a headline number, which indicates the overall health of an economy, and sub-indices, which provide insights into other key economic drivers such as GDP, inflation, exports, capacity utilization, employment and inventories. The PMI data are used by financial and corporate professionals to better understand where economies and markets are headed, and to uncover opportunities.
This article was published by S&P Global Market Intelligence and not by S&P Global Ratings, which is a separately managed division of S&P Global.
{"items" : [
{"name":"share","enabled":true,"desc":"<strong>Share</strong>","mobdesc":"Share","options":[ {"name":"facebook","url":"https://www.facebook.com/sharer.php?u=http%3a%2f%2fstage.www.spglobal.com%2fmarketintelligence%2fen%2fmi%2fresearch-analysis%2fglobal-manufacturing-pmi-slides-to-lowest-since-2012-040619.html","enabled":true},{"name":"twitter","url":"https://twitter.com/intent/tweet?url=http%3a%2f%2fstage.www.spglobal.com%2fmarketintelligence%2fen%2fmi%2fresearch-analysis%2fglobal-manufacturing-pmi-slides-to-lowest-since-2012-040619.html&text=Global+manufacturing+PMI+slides+to+lowest+since+2012+%7c+S%26P+Global+","enabled":true},{"name":"linkedin","url":"https://www.linkedin.com/sharing/share-offsite/?url=http%3a%2f%2fstage.www.spglobal.com%2fmarketintelligence%2fen%2fmi%2fresearch-analysis%2fglobal-manufacturing-pmi-slides-to-lowest-since-2012-040619.html","enabled":true},{"name":"email","url":"?subject=Global manufacturing PMI slides to lowest since 2012 | S&P Global &body=http%3a%2f%2fstage.www.spglobal.com%2fmarketintelligence%2fen%2fmi%2fresearch-analysis%2fglobal-manufacturing-pmi-slides-to-lowest-since-2012-040619.html","enabled":true},{"name":"whatsapp","url":"https://api.whatsapp.com/send?text=Global+manufacturing+PMI+slides+to+lowest+since+2012+%7c+S%26P+Global+ http%3a%2f%2fstage.www.spglobal.com%2fmarketintelligence%2fen%2fmi%2fresearch-analysis%2fglobal-manufacturing-pmi-slides-to-lowest-since-2012-040619.html","enabled":true}]}, {"name":"rtt","enabled":true,"mobdesc":"Top"}
]}


