Customer Logins
Obtain the data you need to make the most informed decisions by accessing our extensive portfolio of information, analytics, and expertise. Sign in to the product or service center of your choice.
Customer Logins
ECONOMICS COMMENTARY
Mar 21, 2022
How to interpret and use the PMI survey output index
The PMI output index is the survey's principal gauge of economic growth and can provide valuable insights into GDP, service sector growth and industrial production trends well ahead of official data. A simple statistical process can be used to produce growth rate equivalents for comparable official economic data. This article explains the methodology behind the output index and how to use the index to track economic growth.
What does it measure?
The PMI survey output index tracks monthly changes in manufacturing production and service sector output, with a composite index reflecting a GDP-weighted average of the two sectors.
What question is asked?
Manufacturing: Please compare the volume of output (in units) produced this month compared to one month ago.
Services: Please compare your level of business activity this month compared to one month ago.
What does it tell us?
The composite output index is the survey's key indicator of what's happened in terms of economic growth each month, and is therefore widely used as a coincident indicator (or 'nowcast' indicator) of GDP and its major manufacturing and service sector components. The manufacturing output index is therefore also a directly comparable measure of industrial production excluding energy and construction.
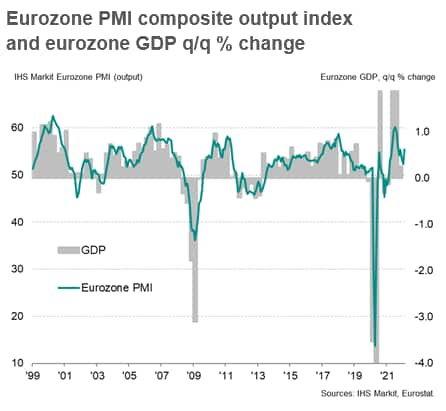
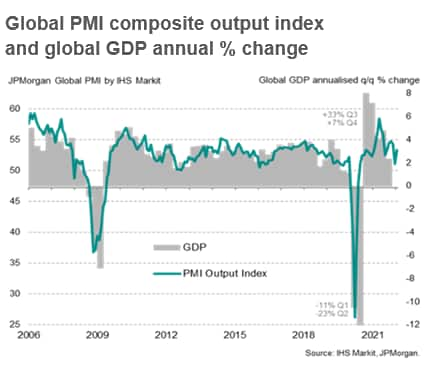
As GDP data are generally produced quarterly rather than at the PMI's monthly frequency, the PMI provides an advance guide to each quarter's GDP number, in most cases being used to anticipate the quarterly or annual rate of change in GDP.
The charts below illustrate clearly how the PMI data provide a useful guide to comparable official GDP data
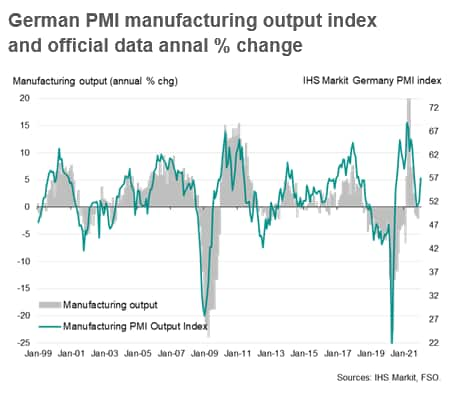
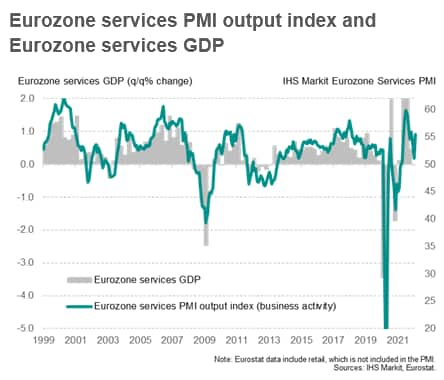
Similarly, the two charts below demonstrate how the PMI manufacturing output index and equivalent services business activity index accurately anticipate comparable official data.
How do I use it?
It is common to use a simple OLS regression analysis to translate the PMI output index into a comparable GDP growth figure, with the PMI index generally used as the sole explanatory (X) variable of the GDP growth rate (Y), as follows:
Y can be either the annual or quarterly GDP growth rate, but in most cases the PMI will act with a lead over the annual rate of one to two quarters, so an appropriate lead/lag needs to be tested for best fit.
Either the monthly PMI data need to be averaged over the calendar quarter or a monthly interpolation of the quarterly GDP data [*] used in the equation.
In the case of the eurozone, the regression yields the following:
Thus, a eurozone PMI composite output index reading of 50 equates to 0.0% GDP growth, a PMI of 55 equates to +0.6% and a reading of 45 equates to -0.5 and so on.
Tips:
Don't confuse the output index with the headline manufacturing PMI - the latter is an amalgamation of survey indices which provides an overall view of changing business conditions, and not a pure measure of production or output. Read more in our headline PMI vs output index research note.
The PMI survey will not necessarily pick up all of the volatility in the official GDP data if the latter are affected by special events or unusual factors (such as a major soya bean export surge, or a massive jump in activity in one particular sector, such as aerospace or pharmaceuticals). Regression fit (and therefore the ability of the PMI to more accurately anticipate GDP data in normal times) can be improved by excluding periods of unusual GDP volatility, such as during the pandemic and periods of unusual economic activity, such as additional public holidays, sporting events such as the Olympics etc.
Similarly, the fit can also be improved by taking a moving average of the GDP data, often two quarters.
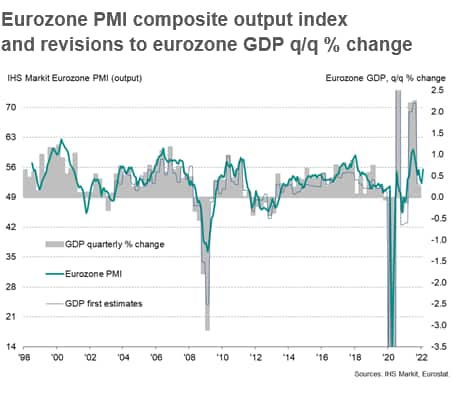
It is also important to bear in mind that, unlike the PMI, the official GDP tend to be revised after first publication. See the example below using eurozone data. Hence, don't be surprised if the initial release of GDP data do not seem to be in line with the PMI, as they will often be revised to be more in line with the survey data.
Further reading
A well-known GDP nowcasting model using the PMI output index was created by European Central Bank researchers, available here, which showed that a tracker of eurozone GDP growth using only the Purchasing Managers' Index (PMI) composite output is of similar accuracy for the final GDP release as the first GDP release, yet is available months in advance of the official data.
More sophisticated forecasting can be undertaken via the use of dynamic factor models, as described here more fully in relation to European PMI data and GDP.
More information on nowcasting is available on our PMI use case library.
Details on some of the other PMI indicators are also available via the following links:
Headline PMI vs. subindices: how signals can be lost by focusing exclusively on the headline PMI
Sign up to receive updated commentary in your inbox here.
*A monthly interpolation of a quarterly series can be calculated by assuming the data point refers to the mid-month of each quarter and the other months use a formula of 2/3 times the nearest quarterly data point and 1/3 times the further data point. Hence March data will be calculated as 2/3 times the February (Q1) data point and 1/3 times the May (Q2) data point. April data will be data will be calculated as 1/3 times the February (Q1) data point and 2/3 times the May (Q2) data point, and so on.
Chris Williamson, Chief Business Economist, S&P Global Market Intelligence
Tel: +44 207 260 2329
chris.williamson@spglobal.com
© 2022, IHS Markit Inc. All rights reserved. Reproduction in whole
or in part without permission is prohibited.
Purchasing Managers' Index™ (PMI™) data are compiled by IHS Markit for more than 40 economies worldwide. The monthly data are derived from surveys of senior executives at private sector companies, and are available only via subscription. The PMI dataset features a headline number, which indicates the overall health of an economy, and sub-indices, which provide insights into other key economic drivers such as GDP, inflation, exports, capacity utilization, employment and inventories. The PMI data are used by financial and corporate professionals to better understand where economies and markets are headed, and to uncover opportunities.
This article was published by S&P Global Market Intelligence and not by S&P Global Ratings, which is a separately managed division of S&P Global.
{"items" : [
{"name":"share","enabled":true,"desc":"<strong>Share</strong>","mobdesc":"Share","options":[ {"name":"facebook","url":"https://www.facebook.com/sharer.php?u=http%3a%2f%2fstage.www.spglobal.com%2fmarketintelligence%2fen%2fmi%2fresearch-analysis%2fhow-to-interpret-and-use-the-pmi-survey-output-index.html","enabled":true},{"name":"twitter","url":"https://twitter.com/intent/tweet?url=http%3a%2f%2fstage.www.spglobal.com%2fmarketintelligence%2fen%2fmi%2fresearch-analysis%2fhow-to-interpret-and-use-the-pmi-survey-output-index.html&text=How+to+interpret+and+use+the+PMI+survey+output+index+%7c+S%26P+Global+","enabled":true},{"name":"linkedin","url":"https://www.linkedin.com/sharing/share-offsite/?url=http%3a%2f%2fstage.www.spglobal.com%2fmarketintelligence%2fen%2fmi%2fresearch-analysis%2fhow-to-interpret-and-use-the-pmi-survey-output-index.html","enabled":true},{"name":"email","url":"?subject=How to interpret and use the PMI survey output index | S&P Global &body=http%3a%2f%2fstage.www.spglobal.com%2fmarketintelligence%2fen%2fmi%2fresearch-analysis%2fhow-to-interpret-and-use-the-pmi-survey-output-index.html","enabled":true},{"name":"whatsapp","url":"https://api.whatsapp.com/send?text=How+to+interpret+and+use+the+PMI+survey+output+index+%7c+S%26P+Global+ http%3a%2f%2fstage.www.spglobal.com%2fmarketintelligence%2fen%2fmi%2fresearch-analysis%2fhow-to-interpret-and-use-the-pmi-survey-output-index.html","enabled":true}]}, {"name":"rtt","enabled":true,"mobdesc":"Top"}
]}


