Customer Logins
Obtain the data you need to make the most informed decisions by accessing our extensive portfolio of information, analytics, and expertise. Sign in to the product or service center of your choice.
Customer Logins
ECONOMICS COMMENTARY
Nov 04, 2019
Measuring the UK services economy: a comparison of GDP and PMI data
- Early official estimates of service sector output are more closely aligned with other indicators, such as business surveys and labour market data, than later estimates (after revisions)
- Latest GDP estimates therefore paint a very different picture of the historical trend in the economy than other indicators
- As PMI data are highly correlated with early GDP estimates, this gives confidence that the surveys are providing useful advance indications of actual economic conditions
A recent ONS paper notes how IHS Markit UK PMI surveys show a strong correlation with official UK gross domestic product (GDP) and its manufacturing and construction sector output components, but that a lack of correlation is seen for the service sector. However, we contend that this raises more questions about the quality of the official service sector data than the PMI.
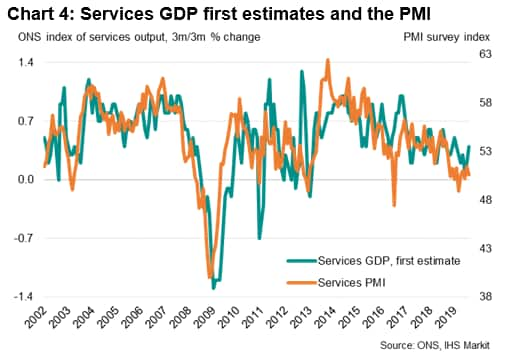
This assertion is based in part on the observation that the ONS's own early estimates of GDP show a poor correlation with their own latest GDP estimates, and that these earlier estimates exhibit a higher correlation with the PMI. This is particularly so for services.
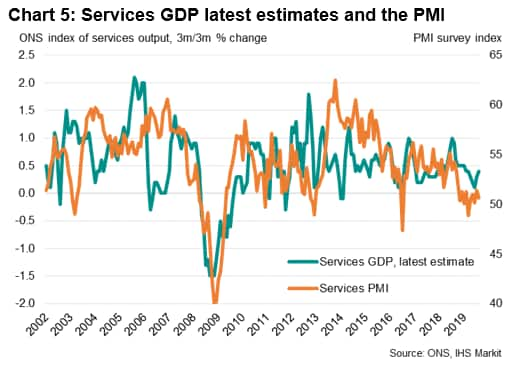
We also observe that the latest vintage of services GDP data used for comparison in the ONS paper has diverged not only from the PMI but also from other related data series, notably other surveys and official labour market statistics, compared to earlier estimates of services GDP. This seems counterintuitive as the more recent GDP estimates are considered by the ONS to be the most accurate, including more comprehensive data and improved methodologies than earlier estimates.
Reassuringly, it is the earlier estimates of GDP that are most influential in guiding policymakers and investors as to the current (or recent) health of the economy, thus the value of the PMI lies in accurately anticipating these early estimates rather than correlating more highly with a heavily-revised data series that is published many years after the time period in question and which is still subject to potential revision.
A following observation is that analysts seeking to use the PMI to anticipate future GDP numbers should be mindful of which 'vintage' of official data they should be comparing the PMI against historically in models. Very different conclusions can be drawn from looking at first estimates and the latest estimates of GDP. Factors affecting the volatility of the official GDP data should also be allowed for.
Exploring the relationship of the PMI with services GDP
First, we look at the findings from the ONS paper. The study compares the PMI survey data, presented as diffusion indices (which converts the number of companies reporting an improvement in output, those reporting no change and those reporting a decline into a single index, which acts as a gauge of monthly changes in output) with the rate of growth in the official GDP data. The paper notes that:
"there is a strong, positive correlation significant at the 95% level between the MBS-based diffusion indices and PMIs, with ONS official estimates of growths for all window sizes considered for the manufacturing and construction sectors and all sector measure. This can be seen from the fact that the DCCA coefficients for these sectors lie above the upper 95% confidence limit. Significant correlations are also found between growths in gross domestic product (GDP) and both all sector diffusion indices, with PMIs interestingly showing a stronger correlation with official estimates of GDP growth than the MBS-based diffusion index.
"However, for the services sector, neither the MBS-based diffusion index nor the PMIs have any significant correlation with headline services three-month on year growths for any window size as can be seen from the fact that their DCCA coefficients lie below the upper 95% confidence interval. This lack of any significant relationship in the services sector may be because there appear to be two distinct periods, from 2012 to 2014, where the diffusion indices and official estimates move in opposite directions and from 2014 onwards, where the diffusion indices and official estimates loosely track each other1."
We find two key issues with this comparison. First, the study only looks at the GDP data from the ONS's latest estimates rather than data published at the time of PMI release. Changing the vintage of data used in the comparison brings some surprising results. Second, the comparison ignores some of the volatility in the ONS data which the PMI cannot be expected to replicate. A notable case being the 2012 Olympics.
Changing vintages, re-writing history
The extent of revisions to official GDP can be striking. The scope for GDP data to be revised after initial publication, at times effectively re-telling history in terms of the economy's health, was in fact a key motivation for our development of PMI surveys in the early-1990s. Poor coverage of the service sector and concerns over data quality were cited by data users such as the Bank of England in encouraging the development of new indicators that filled gaps in data availability, and at the very least acted as 'challenger' data to GDP.
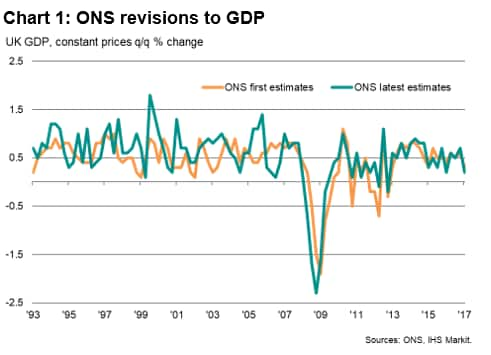
Such concerns are still valid. The ONS produces initial estimates of GDP which are then revised in subsequent estimates, in a process which apparently has no definite end: many years after the first release of data, GDP can be subject to revision. These latest estimates are the ones we now see in historical GDP charts. However, a comparison of first estimates with these latest estimates reveals there is remarkably little resemblance between the two series. Chart 1 below shows the first estimates of GDP compared to the latest estimates back to 1993. Using a simple correlation, where zero means there is no relationship between the two series and one is a perfect match, the correlation of these two series between 1993 and 2007 is just 0.1.
There are clearly some periods when the revisions paint a completely different picture of the health of the economy. For example, the ONS first estimate of GDP in the first quarter of 2003 was one of quarterly growth slowing to 0.2%. This was soon revised to show an even bleaker picture of growth almost stalling at 0.1%. Now, however, the ONS estimates that the economy in fact grew by an impressive 0.8% during this period. The whole growth slowdown of late-2002 and 2003 has in fact been completely erased from history. More recently, the double- and triple-dip recession worries of 2011-13 appear to have been misplaced, as these downturns have also been removed from history.
The fit between first estimates of GDP and the latest estimates improves in recent years, but it remains to be seen whether this represents an improvement in data quality or simply that the more recent data remain prone to revision.
The veracity of the data is all the more important as they influence policy. The Bank of England, for instance, cut interest rates twice during the slowdown of 2003, and also stepped up its stimulus measures via additional quantitative easing in 2012. The same policy decisions would arguably have not been made if policymakers were using the latest estimates of growth at these times. It is therefore important to ascertain whether the early estimates of GDP in fact paint a more accurate picture of the economy's health than the revised estimates.
In theory, the answer should be obvious, with revisions including more comprehensive source data and, in some cases, improved methodologies, for example around seasonal adjustment, to enhance data quality. However, there is evidence to suggest that this is not the case.
Service sector revisions
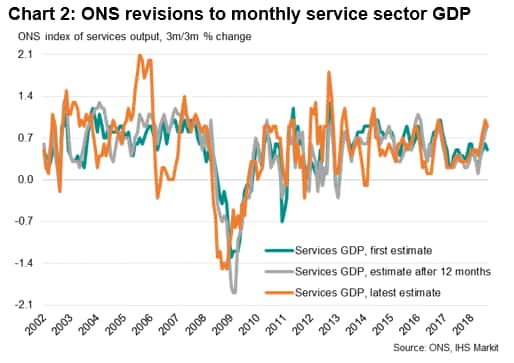
Our focus here is on the service sector component of GDP, where we only have ONS data from 2001 to analyse, but we see a similar picture of history often being rewritten. Moreover, if we include estimates made one year after each period, it is clear that many (but by no means all) of the most severe revisions occur after one year has elapsed.
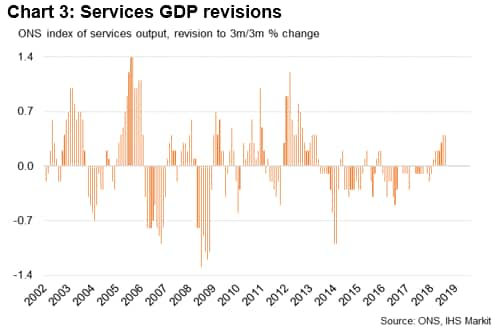
The revisions are by no means insignificant. The average revision for service sector GDP between first estimates and latest estimates over the period 2002 and 2018 is 0.4% (ignoring sign). The largest positive revision has been +1.4% while the largest downward revision has been -1.3%.
Prior to 2013, there appears to have been little evidence of any pattern in terms of revisions being positive or negative, but between mid-2013 and the start of 2018, only seven months saw the services GDP data revised higher, indicating a remarkable period of upward bias in the initial estimates.
Looking at the period 2002 to 2016 (i.e. ignoring the most recent months as these data are still subject to the greatest revisions), the first estimates of services GDP exhibit a correlation of just 0.60 with the latest estimates. Estimates made after one year have a slightly higher correlation with the latest estimates, at 0.65, though for two series that purport to measure the same thing, this is still an intriguingly low measure of fit.
Service sector PMI correlations
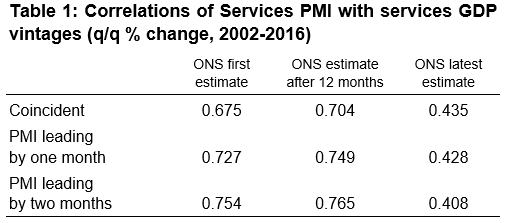
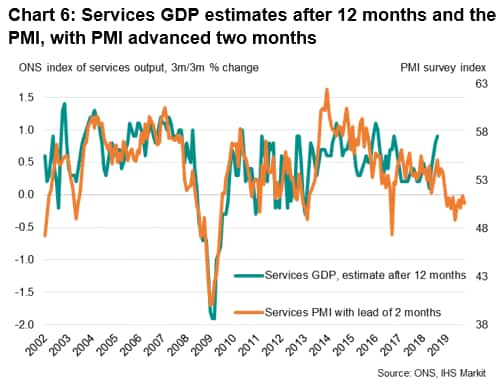
What is interesting is that the early estimates of services GDP (and in fact overall GDP) correlate more highly with the PMI than final estimates, with the best fit seen with GDP estimates made one year after the reference period. See table 1. In fact, the closest correlation (0.765) is observed with the PMI acting with a lead of two months (see chart 6). The correlation with the PMI drops to just over 40% when the latest vintage of GDP is used.
That the PMI shows the highest correlation with an advance of two months is not surprising, as the PMI measures monthly changes in output while the official GDP data are expressed using a three-month-on-three-month change. The fact that the relationship deteriorates with GDP revisions made after the first year is more surprising.
Comparison with other surveys
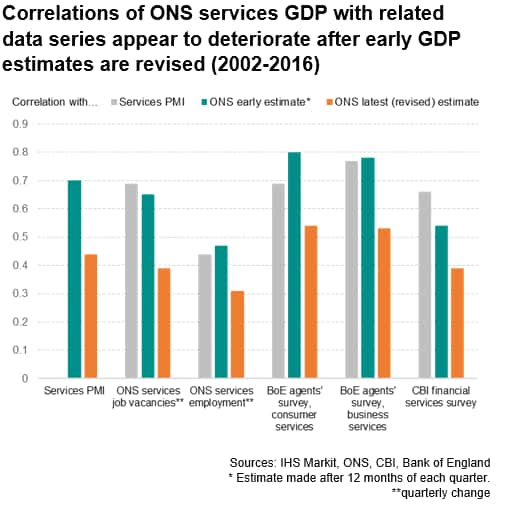
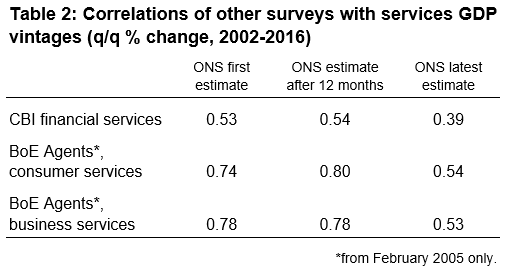
It is in fact not just the PMI survey which shows a higher correlation with early estimates of service GDP than final estimates. The CBI financial services survey and Bank of England (BoE) agents' surveys also display the highest correlations with services GDP estimates made after one year. Like the PMI, the correlation between the CBI and BOE surveys in fact deteriorates markedly with the latest estimates of GDP (see table 2). For example, the correlation between the BoE agents' survey of consumer services rises to 0.80 with the ONS' early estimate, but then falls to just 0.54 with the latest estimates.
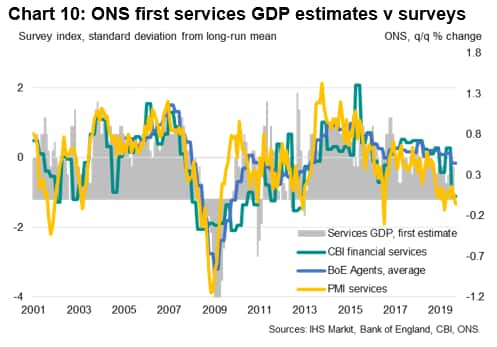
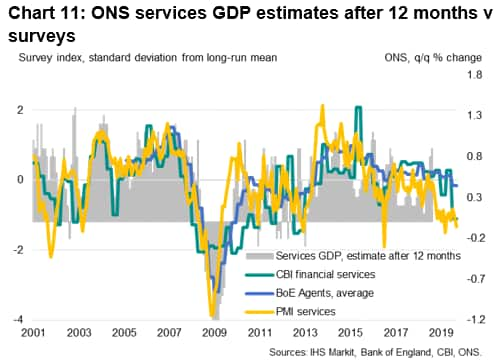
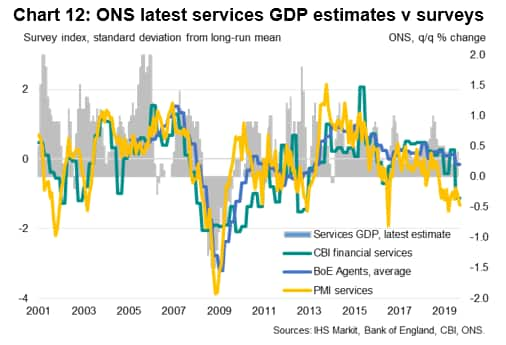
Sometimes, the difference between the surveys and early GDP estimates with latest GDP estimates is very notable. For example, like the PMI, the CBI and BoE data indicated steady and robust growth in 2006, which tallied with initial GDP estimates. However, more recent GDP estimates have changed to signal a stalling of services growth in 2006.
These comparisons therefore add weight to our suspicions that, for reasons we do not fully understand, later revised estimates of GDP diverge from the actual trend in the economy seen over time.
Services GDP and labour market data
A further element of doubt regarding the latest services GDP estimates is raised by comparisons with official labour market data. Productivity changes will naturally be among the factors causing output and employment trends to differ but, in general, output and jobs growth are usually highly synchronised.
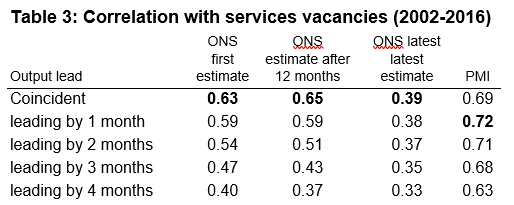
Looking first at ONS data on job vacancies in the services sector, we note that there is a robust correlation between early ONS GDP growth estimates and job vacancies, but that the correlation drops markedly with later GDP estimates. For example, between 2002 and 2016, ONS first estimates of quarterly services GDP growth show a correlation of 0.63 with the three-month change in job vacancies in the sector, which rises to 0.65 when the GDP estimates after one year are used. However, the correlation drops to just 0.39 if the latest GDP estimates are used.
By comparison, the services PMI shows a correlation of 0.69 with job vacancies, rising to 0.72 is the PMI is used with a lead of one month.
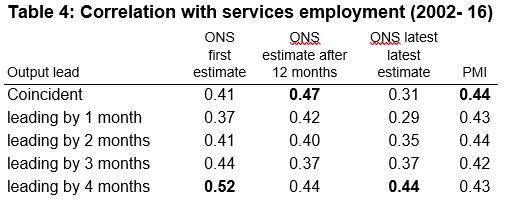
Similarly, the correlation between ONS GDP growth estimates and employment changes between 2002 and 2016 is considerably higher for early GDP estimates (rising to 0.47) than for latest GDP estimates (0.31).
Note that the same conclusion is arrived at even when GDP is advanced to act as a leading indicator of jobs and vacancy growth (see tables 3 and 4, with charts included in appendix. Bold entries in table highlights strongest correlation coefficients).
Deeper dive into 2012-2014 divergence
The ONS study also encouraged us to look further specifically into the greater than usual divergence observed between the services PMI and GDP data in the specific period of 2012 to 2014. However, we note that this was a particularly unusual period for the economy in several respects:
- Early 2012 saw the Queen's Golden Jubilee, which distorted business and consumer activity, not least due to an additional public holiday which was estimated to have caused GDP to fall by approximately 0.5%.
- 2012 also saw London host the Olympics, an event which substantially boosted GDP (notably in the service sector) through ticket sales (not included in the PMI).
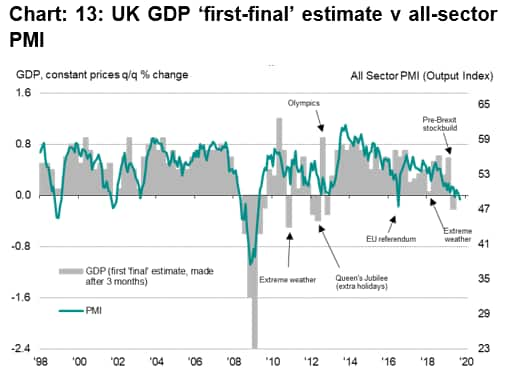
We would argue that, outside of these events, the PMI in fact correlated extremely well with the GDP data (both for services and the wider economy as a whole - see chart 13 below), notably picking up the strong expansion of growth in 2013 and into 2014. Note that this was also a period in which the sharp acceleration of growth led the unemployment rate to plummet from 7.8% in mid-2013 to below 6% by the end of 2014.
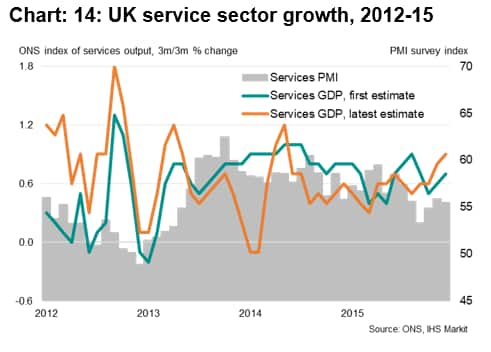
Oddly, a considerable extent of the initial strength of the 2014 recovery signalled by early GDP estimates has now been revised away (see chart 14), revealing an illustration of how revisions to GDP data appear to change history to a version that arguably seems to now bear little resemblance to what actually happened at the time.
Further investigation required
Because early estimates of services GDP are considerably more closely aligned with the business surveys and labour market data historically than the latest (revised) GDP estimates, we would encourage more research to be conducted into what causes the revisions to the official GDP data after the first year of estimation. It may be explained by subsequent estimates of GDP being revised as the methodology incorporates more data on incomes and expenditure rather than a focus on pure output used in the early estimates, but this is speculation at this stage.
1 The study in fact finds the highest correlations are observed with the PMI compared against the change in the latest three months compared to the same period one year ago. However, for the purpose of this paper, we use comparisons of the latest three months versus the prior three months, as these growth rates are available for the different 'vintages' of ONS estimates.
Chris Williamson, Chief Business Economist, IHS
Markit
Tel: +44 207 260 2329
chris.williamson@ihsmarkit.com
© 2019, IHS Markit Inc. All rights reserved. Reproduction in whole
or in part without permission is prohibited.
Purchasing Managers' Index™ (PMI™) data are compiled by IHS Markit for more than 40 economies worldwide. The monthly data are derived from surveys of senior executives at private sector companies, and are available only via subscription. The PMI dataset features a headline number, which indicates the overall health of an economy, and sub-indices, which provide insights into other key economic drivers such as GDP, inflation, exports, capacity utilization, employment and inventories. The PMI data are used by financial and corporate professionals to better understand where economies and markets are headed, and to uncover opportunities.
This article was published by S&P Global Market Intelligence and not by S&P Global Ratings, which is a separately managed division of S&P Global.
{"items" : [
{"name":"share","enabled":true,"desc":"<strong>Share</strong>","mobdesc":"Share","options":[ {"name":"facebook","url":"https://www.facebook.com/sharer.php?u=http%3a%2f%2fstage.www.spglobal.com%2fmarketintelligence%2fen%2fmi%2fresearch-analysis%2fmeasuring-the-uk-services-economy-a-comparison-of-gdp-and-pmi-data-nov19.html","enabled":true},{"name":"twitter","url":"https://twitter.com/intent/tweet?url=http%3a%2f%2fstage.www.spglobal.com%2fmarketintelligence%2fen%2fmi%2fresearch-analysis%2fmeasuring-the-uk-services-economy-a-comparison-of-gdp-and-pmi-data-nov19.html&text=Measuring+the+UK+services+economy%3a+a+comparison+of+GDP+and+PMI+data+%7c+S%26P+Global+","enabled":true},{"name":"linkedin","url":"https://www.linkedin.com/sharing/share-offsite/?url=http%3a%2f%2fstage.www.spglobal.com%2fmarketintelligence%2fen%2fmi%2fresearch-analysis%2fmeasuring-the-uk-services-economy-a-comparison-of-gdp-and-pmi-data-nov19.html","enabled":true},{"name":"email","url":"?subject=Measuring the UK services economy: a comparison of GDP and PMI data | S&P Global &body=http%3a%2f%2fstage.www.spglobal.com%2fmarketintelligence%2fen%2fmi%2fresearch-analysis%2fmeasuring-the-uk-services-economy-a-comparison-of-gdp-and-pmi-data-nov19.html","enabled":true},{"name":"whatsapp","url":"https://api.whatsapp.com/send?text=Measuring+the+UK+services+economy%3a+a+comparison+of+GDP+and+PMI+data+%7c+S%26P+Global+ http%3a%2f%2fstage.www.spglobal.com%2fmarketintelligence%2fen%2fmi%2fresearch-analysis%2fmeasuring-the-uk-services-economy-a-comparison-of-gdp-and-pmi-data-nov19.html","enabled":true}]}, {"name":"rtt","enabled":true,"mobdesc":"Top"}
]}


