Customer Logins
Obtain the data you need to make the most informed decisions by accessing our extensive portfolio of information, analytics, and expertise. Sign in to the product or service center of your choice.
Customer Logins
ECONOMICS COMMENTARY
May 06, 2020
Nowcasting European GDP during an economic shock
- Tracking economic growth with traditional nowcasting models remains challenging
- Switching to simpler PMI models likely to yield better estimates of current downturn…
- …but important to account for non-linearity and 'signal' dampening
Since last July, we have been utilising a technique called 'dynamic factor' modelling to provide high-frequency estimates of current quarter GDP, leaning heavily on the signals provided by our PMI data.
However, in the face of recent events, we've found these models have been a little slow to react to sudden changes in economic conditions, particularly in the face of unforeseen shocks. We noted that, in these instances, reverting to more simplistic model specifications is likely to yield more reliable indications of current economic activity.
That said, even this approach can quickly run into problems with evidence that the traditional linear relationship between our PMIs and changes in GDP could break down in extreme circumstances.
We therefore propose a new working nowcast model to track current quarterly changes in GDP, which not only accounts for both the non-linear quirks in this traditionally strong positive linear relationship, but also aims to maximises the signals from the survey data.
PMI Nowcasting: Second quarter dynamic factor model estimates
To understand some of the current issues with our usual approach, we use dynamic factor models to estimate changes in second quarter GDP.
Based on available data, our dynamic factor model estimates the euro area economy to contract by -3.1% on the previous quarter in Q2. While this is still a sizeable decline which would put the eurozone in its deepest recession since the currency bloc formed, it's clear this is likely to understate the true extent of the ultimate second quarter decline given the scale of the COVID-19 related lockdowns imposed across the world.
Meanwhile, we still lack some crucial official data series for March for the UK, as these components helped the dynamic factor estimate for the eurozone to better capture the unfavourable economic effects of the pandemic. The dynamic factor model estimates a quarterly decline of just -2.2% for the UK which again is most likely a notable under-estimation of reality.
PMI Nowcasting Models: Temporal Aggregation and Non-Linearity
In early April we discussed the potential benefits of switching from a dynamic factor approach to a more simple, parsimonious model that principally uses PMI data when nowcasting economic activity at times of severe economic stress.
Since our most recent update, two issues have become increasingly apparent.
Firstly, averaging monthly data over a quarter (as traditional nowcasting applications usually do when estimating changes in quarterly GDP) tends to dampen the signal from the PMI.
Secondly, there is evidence that the traditional linear relationship between PMI and changes in GDP is likely to break down at extreme PMI levels. That is, for reasons that we can only speculate on, movements in the PMI to either extremely low or extremely high readings may imply much greater swings in GDP than a linear relationship would usually imply.
In this section, we therefore present some thoughts on how to deal with these issues and continue to effectively utilise PMI data in simple nowcasting applications for the eurozone and the UK.
Temporal Aggregation
Whilst dynamic factor models play a crucial role in our understanding of the position of the business cycle during a quarterly nowcasting period, the vast use of both official data and temporal aggregation can lead to delays in picking up rapid changes in economic activity - as we saw with our nowcasting models in early April.
Indeed, temporal aggregation of factors, or any economic indicator for that matter, into the same time frequency as GDP (e.g. such as taking an average of monthly readings to match-up with a quarterly figure), comes with the danger of "dampening the signal" from reliable indicators that can move in an extreme fashion during the initial phase of an economic shock.
Non-Linearity
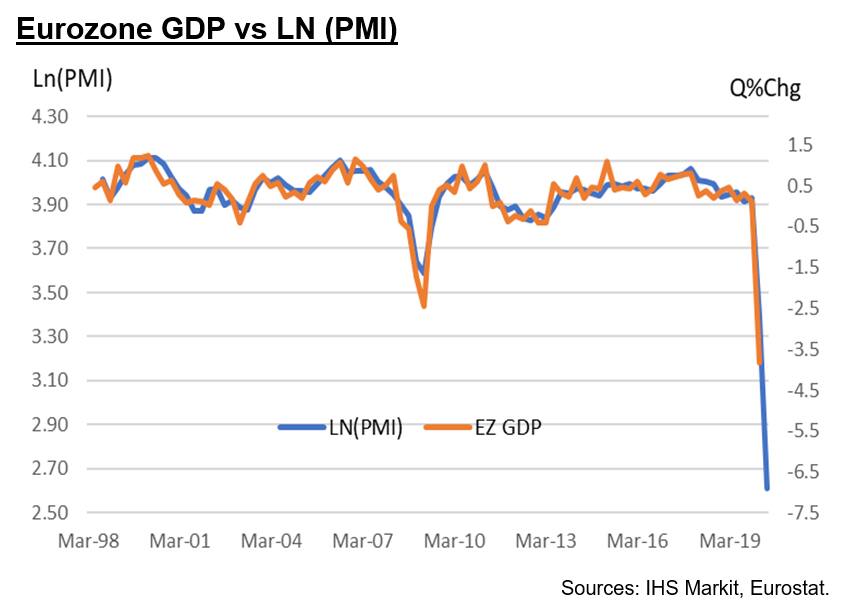
PMIs and GDP data tend to be highly correlated with each other. Given the characteristics of timeliness, non-revision and accuracy, the PMI is naturally seen by many as a strong candidate for nowcasting GDP.
Moreover, despite PMIs being primarily designed to measure breadth of changes in economic activity, rather than depth, the relationship between PMI and GDP can usually be successfully modelled in easy-to-estimate linear models.
However, given the PMI is a diffusion index that is bounded between zero and 100, when we observe extreme changes in GDP (such as in a financial crisis, or more pertinently a pandemic) the usual linear relationship with GDP can imply readings of the PMI that pass through its defined boundaries.
To account for the challenges related to temporal aggregation and impossible PMI readings during periods of extreme recession or excessive growth, and to provide followers with a better understanding of likely changes in GDP based on current PMI readings, we propose making two adaptions to the simple linear model.
Firstly, we introduce non-linear dynamics through the creation of a linear-log model, where changes in GDP are now explained by taking the natural logarithm of the PMI (rather than using the PMI as usually provided in diffusion index form). This allows us to provide stronger estimates of GDP at low (or high) PMI readings when the data are pointing to considerable reductions (or rises) in GDP but still ensuring the PMI remains bounded between zero and 100.
Secondly, we propose placing more weight on single monthly readings rather than using some aggregation method when attempting to nowcast economic activity.
Therefore, in our two applications below, we use the natural logarithm of the final PMI observation of a calendar quarter. Exceptions are made for the global financial crisis and the current situation where we take the lowest reading over the quarter if the PMI is viewed to be in a downturn, and highest if the PMI has moved into an upturn.
Applications
These adaptions to the usually linear relationship provide a stronger sense of the scale of the current downturns likely hitting the euro area and UK economies.
Firstly, for the eurozone, we find that by using the natural logarithm of the headline composite PMI then the model implies a -7.4% drop in GDP during the second quarter of 2020. That compares to a -4% drop if using the usual linear relationship (i.e. inputting the PMI into a basic OLS regression without any transformation). To get a GDP estimate of -7.4% using the usual linear relationship requires a nominal PMI reading of -7.5 (an impossible outturn).

Moreover, to provide a sense of the benefit of accounting for the 'non-linearity' that may exist between the PMI and GDP, this new approach yielded a Q1 GDP drop of -2.9% (a reasonable estimate given the Eurostat first estimate is -3.8%). Following the 21-point drop between February and March, the latest 16-point decline in the PMI between March and April to a new record low of 13.7 indicated an additional 4.5 percentage deterioration in Eurozone GDP.
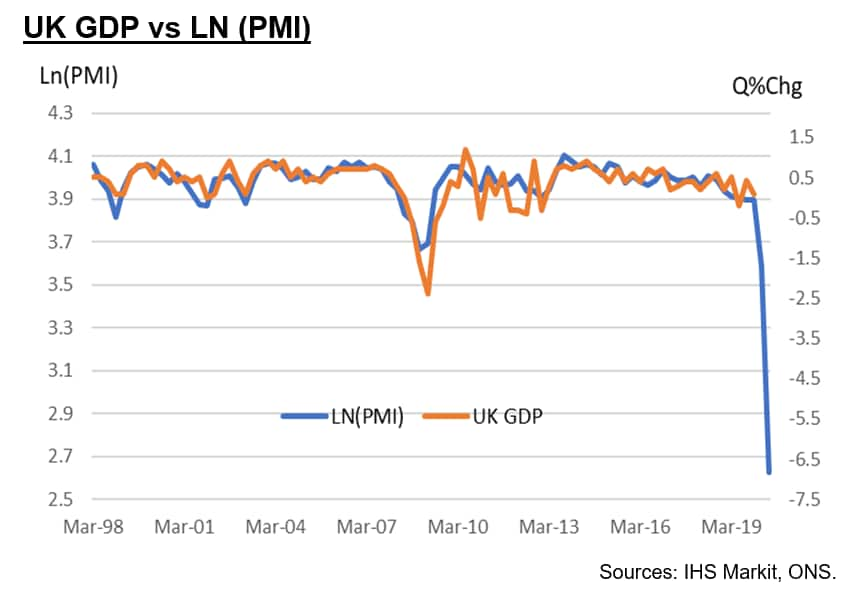
Turning to the UK, the non-linear approach signals a fall in GDP of around -6.6% during the second quarter of the year, following an implied drop of -1.7% in the opening three months of the year.
Again, using the traditional linear relationship and the implied fall in GDP from the PMI reading is -3.3% for the second quarter, a marked contraction, but one that is unlikely to fully capture the scale of the downturn in Q2 GDP.

Summary
Traditional nowcasting approaches have recently struggled to capture the scale of the downturn in economic output occurring across developed economies in recent weeks. We put this down in part to both a combination of temporal aggregation and reliance on slow to be released official data in these models.
In extreme situations it may be best to switch to more timely indicators which can offer a much quicker indication of the potential size of any large contraction or expansion in GDP.
However, observable linear relationships between closely watched PMIs and GDP can also break down in times of rapid economic change. This requires some creative thinking about how best to optimise the clear signal from the PMIs.
Firstly, we propose shifting away from usual temporal aggregation methods to place much more emphasis on extreme PMI readings when estimating quarterly changes in GDP.
Secondly, accounting for the non-linear relationship that can exist between PMI and GDP yields more realistic estimates of quarterly changes in economic output than the traditional linear approach.
Joe Hayes, Economist, IHS Markit
Tel: +44 1491 461006
joseph.hayes@ihsmarkit.com
Paul Smith, Economics Director, IHS Markit
Tel: +44 1491 461038
paul.smith@ihsmarkit.com
© 2020, IHS Markit Inc. All rights reserved. Reproduction in whole
or in part without permission is prohibited.
Purchasing Managers' Index™ (PMI™) data are compiled by IHS Markit for more than 40 economies worldwide. The monthly data are derived from surveys of senior executives at private sector companies, and are available only via subscription. The PMI dataset features a headline number, which indicates the overall health of an economy, and sub-indices, which provide insights into other key economic drivers such as GDP, inflation, exports, capacity utilization, employment and inventories. The PMI data are used by financial and corporate professionals to better understand where economies and markets are headed, and to uncover opportunities.
This article was published by S&P Global Market Intelligence and not by S&P Global Ratings, which is a separately managed division of S&P Global.
{"items" : [
{"name":"share","enabled":true,"desc":"<strong>Share</strong>","mobdesc":"Share","options":[ {"name":"facebook","url":"https://www.facebook.com/sharer.php?u=http%3a%2f%2fstage.www.spglobal.com%2fmarketintelligence%2fen%2fmi%2fresearch-analysis%2fnowcasting-european-gdp-during-an-economic-shock-may20.html","enabled":true},{"name":"twitter","url":"https://twitter.com/intent/tweet?url=http%3a%2f%2fstage.www.spglobal.com%2fmarketintelligence%2fen%2fmi%2fresearch-analysis%2fnowcasting-european-gdp-during-an-economic-shock-may20.html&text=Nowcasting+European+GDP+during+an+economic+shock+%7c+S%26P+Global+","enabled":true},{"name":"linkedin","url":"https://www.linkedin.com/sharing/share-offsite/?url=http%3a%2f%2fstage.www.spglobal.com%2fmarketintelligence%2fen%2fmi%2fresearch-analysis%2fnowcasting-european-gdp-during-an-economic-shock-may20.html","enabled":true},{"name":"email","url":"?subject=Nowcasting European GDP during an economic shock | S&P Global &body=http%3a%2f%2fstage.www.spglobal.com%2fmarketintelligence%2fen%2fmi%2fresearch-analysis%2fnowcasting-european-gdp-during-an-economic-shock-may20.html","enabled":true},{"name":"whatsapp","url":"https://api.whatsapp.com/send?text=Nowcasting+European+GDP+during+an+economic+shock+%7c+S%26P+Global+ http%3a%2f%2fstage.www.spglobal.com%2fmarketintelligence%2fen%2fmi%2fresearch-analysis%2fnowcasting-european-gdp-during-an-economic-shock-may20.html","enabled":true}]}, {"name":"rtt","enabled":true,"mobdesc":"Top"}
]}


