Customer Logins
Obtain the data you need to make the most informed decisions by accessing our extensive portfolio of information, analytics, and expertise. Sign in to the product or service center of your choice.
Customer Logins
BLOG
Nov 29, 2018
It has never been easier to short Tesla, any takers?
- Borrowed shares have declined by 7m shares in November
- Shares available at post-IPO peak 16m shares
- Borrow fee at GC level for first time in over 5 years
- Cost for short credit exposure near YTD low
The first eight years of the Tesla short have not gone exactly to plan for the bear camp. During that time, short sellers have paid above GC (general collateral) borrow fees while the share price has trended higher with significant volatility. That appears to be changing, at least the borrow cost part.
Since the start of November, the number of TSLA shares borrowed has declined by 6.9m shares to a YTD low of 22.4m. The exchange short interest number which was released Tuesday night, pertaining to November 15th, came in at 28.8m shares, revealing a reduction of 1.1m shares during the first two weeks of the month. IHS Markit's short interest forecast model suggests that the total short interest fell a further 1.5m shares over the last two weeks of November, to 27.9m, the lowest level since March. Please see appendix for more detailed run-down on measuring US equity short interest.

The widening gap between borrows (22.4m) and short interest (27.9m) suggests that brokers uncovered ~5m shares of new internal inventory during the first two weeks of November. The most dynamic part of broker's internal supply are hedge fund long positions, especially for stocks like Tesla which aren't significant index constituents. The implication is that there was likely long buying on the part of hedge funds in early November, though it may well have been hedges to call options purchased by shorts to hedge their position positions.
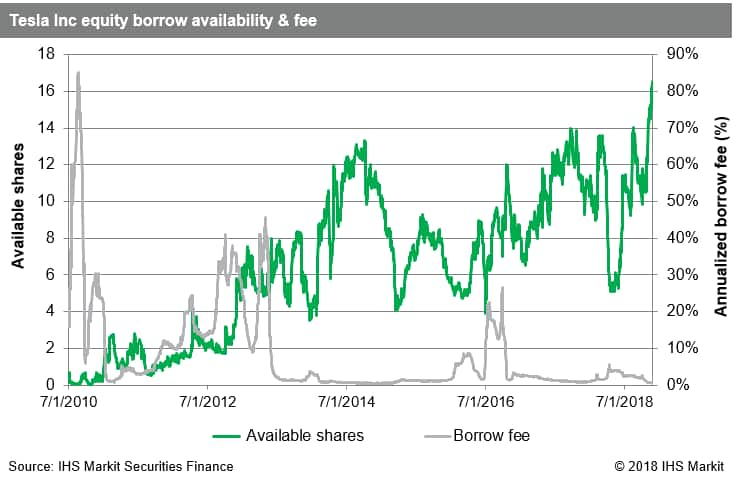
That additional broker-dealer supply, in addition to shares being returned in the securities lending market, have resulted in a significant increase in availability of shares to borrow. Lenders are reporting 16m shares as currently available, equating to $5.4bn; both figures are a post-IPO high for the stock. The total size of the lendable pool, including shares already lent out, has been consistently in the range of 30-31m shares since the start of November, so recent securities lending availability increase is purely the result of existing borrows being returned. Lendable shares hit an all-time high of 32.4m on September 27th, subsequently declining by 2m as beneficial owners pulled some shares out on the margin, which may have been sold.

The increased availability has eased borrow rates, which are GC for the first time since briefly dipping in late 2013 and early 2014. Since March of 2014, it has never been cheaper to short TSLA equity and there has never been this much available capacity at any cost.
The most expensive borrow costs recorded for Tesla were shortly following IPO in 2010 when average rate for all borrows briefly eclipsed 80%, annualized. More memorable, painfully for short sellers, was the borrow constraint surrounding the Solar City acquisition in September 2016, when the average borrow fee was over 40% for existing short positions and the marginal cost for new borrows touched 90%.

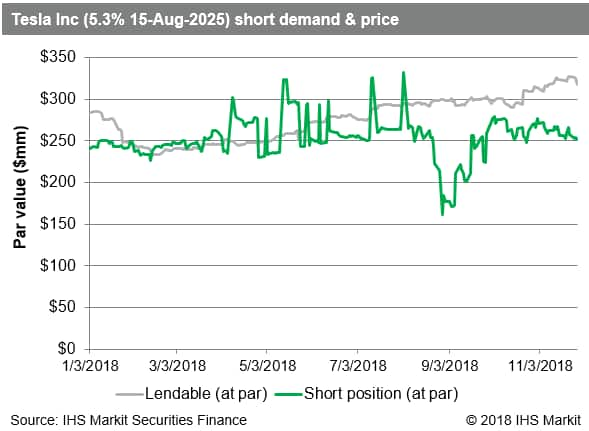
The pricing for short exposure to Tesla credits has also declined. After peaking above 500bps ahead of Q2 earnings in August, the cost to borrow the 5.3% 2025 bond has declined by more than 50%. Initially the reduction in borrow cost was driving by short sellers returning bonds, however the level of demand returned to the YTD average of ~$250m par value by the start of October. The further reduction in borrow fee since then has been driven by increasing supply from beneficial owners, who have added $85m par value to lending programs since the low point observed in mid-February. The spikes in the borrow chart, above availability from lenders, reflects inter-broker borrows.

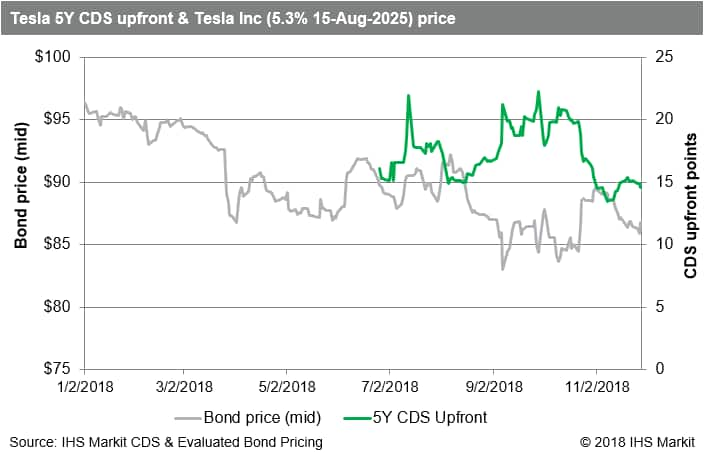
In a similar vein, the upfront points for TSLA 5Y CDS are currently 14.6, having declined from a peak of 22.3 on September 28th as news broke that the SEC was charging Elon Musk with securities fraud. The recent pricing for credit protection has increased on the margin since November 8th, when 13.44 marked the lowest level since Tesla CDS started trading in earnest in mid-June. Despite the tightening upfront cost over the last two months, Tesla is still in the top quintile for most expensive credit protection in the CDX NA HY index.
Wrap-up:
Taken together the reduction in equity demand combined with increased supply on the credit side have driven a dramatic reduction in the cost of placing bets against the future of the electric auto-maker across the capital structure. Given the Q3 earnings results, and the market reaction to them, it's no surprise that bears have reduced the position on the margin and that some investors have positioned themselves to benefit from further short covering and continued enthusiasm from the firm's investor base. While the share price has bounced 39% off the YTD low, and is only 15% below the all-time-high observed in June 2017, bears can at least enjoy a lower cost of admission to the short trade, for the time being anyway. With a current short balance of $9.9bn the bearish sentiment is still significant and the lower carrying cost makes the position easier to manage for short sellers heading into 2019.
For the greatest depth and history of short interest and securities lending data, including the real-time intraday dataset, please reach out to your IHS Markit sales coverage, also available via:
NA-SalesSpecialistsEquities@ihsmarkit.com
Appendix - Measuring US equity short interest
Short interest for US equities is collected twice monthly per FINRA regulations. US broker-dealer entities report on behalf of themselves and their clients. That dataset is distributed by the exchange where an equity is primarily listed eight settlement days following the settlement date on which the data was collected. Given that the dataset is tied to a given settlement date you can do an apples-to-apples comparison with securities lending data for that date and then extrapolate to estimate the current short interest based on borrowing trends and the proportion of total shares short which have been borrowed.
The gap between what is shorted and what is reported to the exchange primarily consists of shares which the brokers can source internally, i.e.. borrow from prime brokerage clients or other assets the dealer holds on their balance sheet. For example, a delta-1 desk may be long stock against a derivative position. For stocks which are significant constituents of the major indices, or which are widely held hedge fund longs, there will be more internal supply available to broker-dealers.
In this report all data points are displayed along with the settlement date that they pertain to. This is a standard practice when displaying the exchange short interest data, however it belies the importance of securities lending data in that the latter is reported on settlement+1, whereas the exchange data is reported settlement+8. To the extent that borrows and modeled SI match the exchange SI on the settlement dates for which it is collected there is a 7-day informational advantage to incorporating the IHS Markit Securities Finance alternative dataset, in addition to the value of seeing daily observations. Data presented has not been altered after the fact and reflects the point in time publish of the dataset.
S&P Global provides industry-leading data, software and technology platforms and managed services to tackle some of the most difficult challenges in financial markets. We help our customers better understand complicated markets, reduce risk, operate more efficiently and comply with financial regulation.
This article was published by S&P Global Market Intelligence and not by S&P Global Ratings, which is a separately managed division of S&P Global.
{"items" : [
{"name":"share","enabled":true,"desc":"<strong>Share</strong>","mobdesc":"Share","options":[ {"name":"facebook","url":"https://www.facebook.com/sharer.php?u=http%3a%2f%2fstage.www.spglobal.com%2fmarketintelligence%2fen%2fmi%2fresearch-analysis%2fpeak-borrow-availability-for-tesla-shorts.html","enabled":true},{"name":"twitter","url":"https://twitter.com/intent/tweet?url=http%3a%2f%2fstage.www.spglobal.com%2fmarketintelligence%2fen%2fmi%2fresearch-analysis%2fpeak-borrow-availability-for-tesla-shorts.html&text=It+has+never+been+easier+to+short+Tesla%2c+any+takers%3f+%7c+S%26P+Global+","enabled":true},{"name":"linkedin","url":"https://www.linkedin.com/sharing/share-offsite/?url=http%3a%2f%2fstage.www.spglobal.com%2fmarketintelligence%2fen%2fmi%2fresearch-analysis%2fpeak-borrow-availability-for-tesla-shorts.html","enabled":true},{"name":"email","url":"?subject=It has never been easier to short Tesla, any takers? | S&P Global &body=http%3a%2f%2fstage.www.spglobal.com%2fmarketintelligence%2fen%2fmi%2fresearch-analysis%2fpeak-borrow-availability-for-tesla-shorts.html","enabled":true},{"name":"whatsapp","url":"https://api.whatsapp.com/send?text=It+has+never+been+easier+to+short+Tesla%2c+any+takers%3f+%7c+S%26P+Global+ http%3a%2f%2fstage.www.spglobal.com%2fmarketintelligence%2fen%2fmi%2fresearch-analysis%2fpeak-borrow-availability-for-tesla-shorts.html","enabled":true}]}, {"name":"rtt","enabled":true,"mobdesc":"Top"}
]}


