Customer Logins
Obtain the data you need to make the most informed decisions by accessing our extensive portfolio of information, analytics, and expertise. Sign in to the product or service center of your choice.
Customer Logins
EQUITIES COMMENTARY
Apr 03, 2020
Q1 Securities Finance Snapshot
$2.29bn in Q1 securities lending revenue
- Global revenue -5.5% YoY for Q1
- ETF loan balances reach all-time high in March
- Global increase in utilization
- Event driven revenues for US equities
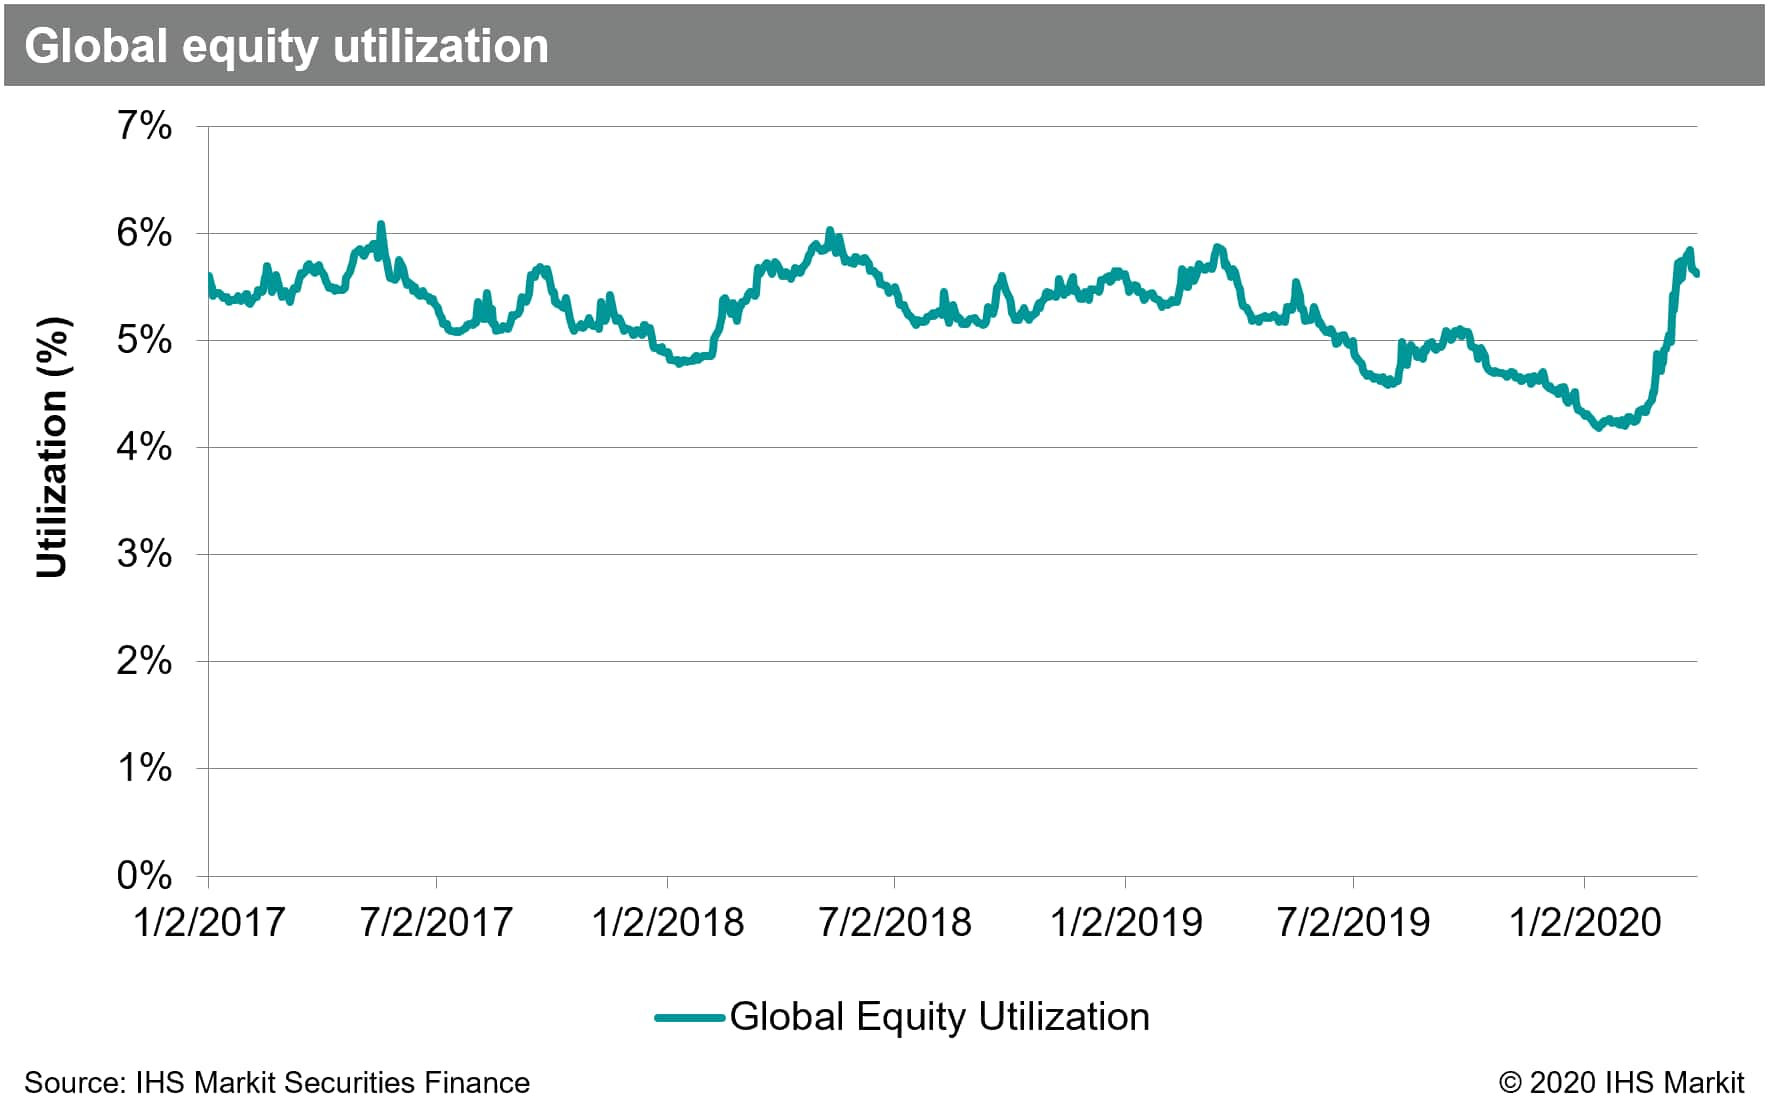
With the global economic havoc caused by COVID-19, securities lending revenues declined 18% YoY for the month of March, despite an increase in borrow demand for some asset classes, most notably exchange traded funds. Total Q1 revenues decreased by 5.5% YoY, however that belies the evolving mix of demand drivers and spread incomes. After reaching an all-time low in mid-January, equity utilization increased by a third to end March at 5.6%.

Driving the increase in utilization, global equity lendable assets declined at a more rapid pace than loan balances, causing the largest one 30-day increase in utilization since May 2011. The peak in utilization was on March 23rd, reversing the last twelve months during which lendable asset growth dramatically outpaced borrow demand.
Global equity borrow demand increased globally over the first two weeks of March, resulting in loan balances only declining by 3%; most equity indices declined by at least three times that amount. There are a few factors at play, likely including borrow demand for new shorts, both single name and borrows for creation of ETFs. Another potential factor is dealers shifting sources of borrow, from internal to external, for existing short positions.
North American equity revenues came in at $884m for Q1, a decline of 9% QoQ compared with Q4 2019. The major event in March from a revenue perspective was the McKesson exchange offer for shares of Change Healthcare on March 9th, which generated just over $33m in reported revenue.
Some context for US equity borrow demand is provided by the bi-monthly reporting of US broker-dealer short positions via exchanges. Year to date, through the most recent March 13th short interest reporting, the value of short positions declined by $181bn or 21%; the value of US equity borrows reported to IHS Markit only fell by $42bn YTD, or 8%. The ratio of value of borrowed shares to value of reported short positions reached 72% on February 13th, up from 61% as of the end of December. The implication is that the combination of borrows for create-to-lend ETFs and replacement of previously dealer internalized borrows caused loan balances to decline by less than short interest values.
Asia equity revenues totalled $427m in Q1, a 22% decline YoY and a 2% decline QoQ compared with Q4. That makes Q1 the least revenue generating quarter for lending Asia equities since Q2 2017. The general trend in the region of more GC demand and fewer specials remains in place. Asia equity lendable assets reached $2T for the first time in late December 2019 and set a new all-time high of $2.1T in early January.
European equity revenues totalled $282m in Q1, -22% YoY. The Q1 revenues were the lowest for any quarter since Q3 2014. Compared with Q1 2019, loan balances and fees are down, depressing revenues, while lendable assets have increased, pushing down on utilization. The utilization down trend did reverse course in March, which may set the table for increase returns to lendable assets in Q2.

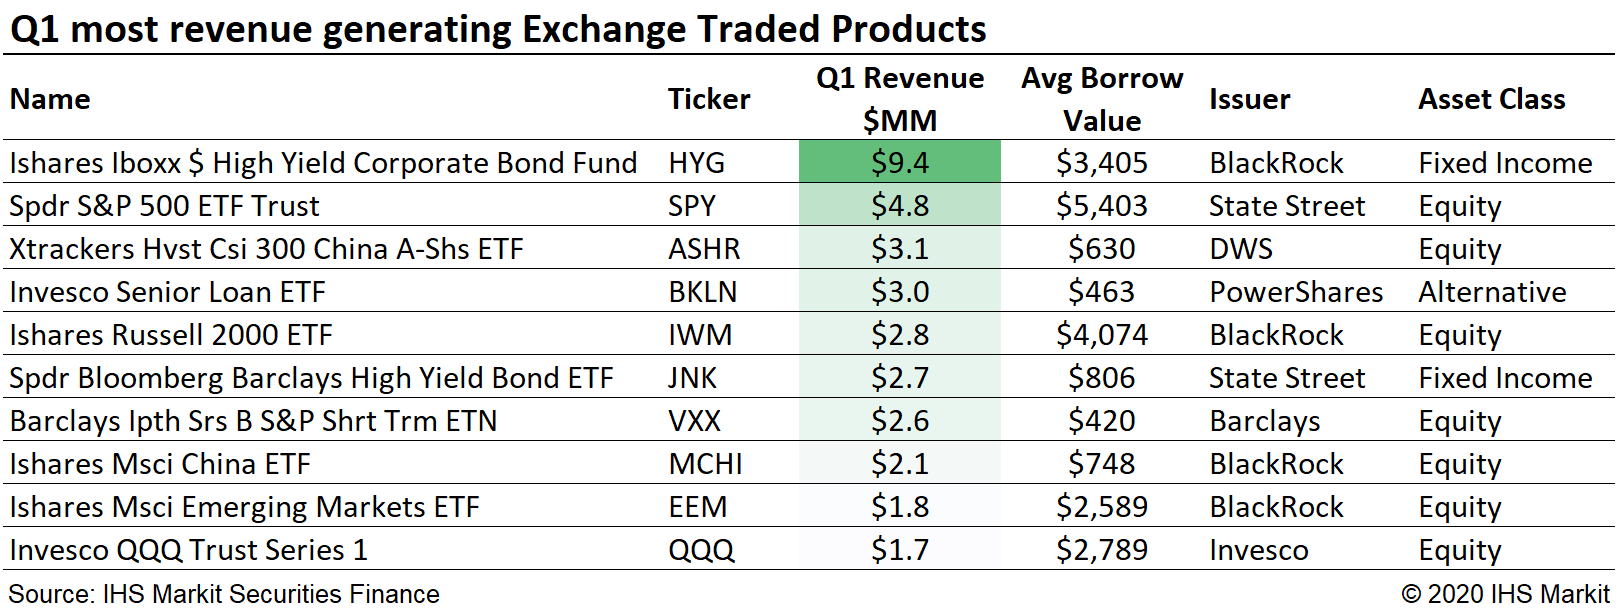
Borrow demand for ETFs surged in late February and early March. Revenues from lending ETFs also increased, with $97m in Q1 revenue, the most since Q4 2018 record of $107m. The uptick in demand was broad and the top 10 most revenue generating funds paint a portrait of what was on the minds of investors in Q1; high-yield credit, EM/China focus and US equities across the market capitalization spectrum. The revenue from lending fixed income funds came in at $24m in Q1, more than doubling the returns in Q4, and delivering 28% of all ETF lending revenues. Part of the uptick in borrow demand for ETFs in was likely driven by short term unwinding create-to-lend trades, which is reflected in increased borrow demand for ETF shares (beyond changes in short interest), with similar dollar amount outflows from the funds. Those flows may have reversed over the last two weeks of March, with substantial inflows to ETFs, increases in GC single name borrowing and a decrease in borrow demand for ETF shares.
Given the stress in credit markets, it's interesting to note that there's been relatively little pickup in lending revenues or spreads for corporate bonds, despite global CDS indices reaching post-GFC wides in March. There was some pickup in borrow demand during the first week of March, pushing global corporate bond loan balances to a post-GFC peak of $213bn on March 9th; the uptick in demand was short-lived and failed to produce a substantial increase in revenue. The failure of increasing demand to push up on revenues was partly due to the concentration in demand for investment grade credits. After the brief increase in demand high-yield revenues declined over the last two weeks of March, doubly put upon by falling valuations and an active reduction in face value on loan.
Borrow demand for sovereign debt has been relatively flat, with fees being the more dynamic aspect for the asset class. Over the course of Q1 sovereign loan balances increased by 4%, while loan balances with negative spreads fell by 9%.
Conclusion:
As noted in our February update, securities finance revenues often pick up in times of market stress, which is most often true in terms of returns on lendable assets, but also sometimes true in absolute revenue terms, for example US equity and credit for late-2015/early-2016, EM equity for middle of 2018, EU equities in 2012 and ETFs in Q4 2018. Exchange traded funds and GC equities have been the primary beneficiary of increased borrow demand and revenues during the virus related 2020 economic slowdown. Equity balances have proven resilient, leading to an increase in utilization, however lower fee spreads have slowed the increase of return on lendable assets (also worth noting the increase in utilization is coming off the all-time low). There has been a dearth of emergent equity specials during the sell-off, however given the speed of the decline it makes sense that demand for liquid hedges have led borrow demand. Going forward the lack of IPOs with lockup expiries will be felt in YoY comparisons, however not all demand drivers for 2019 have dried up, with the Cannabis sector still seeing outsized fees and revenues. The relative stability in government debt lending revenues, and the ongoing stress in credit markets, may drive increased fixed income revenues going forward (provided the asset classes aren't purchased wholly by central banks). As the global economy reacts to the stoppage of activity resulting from the pandemic, the uncertainty of future investment returns is elevated and the need to both hedge exposures and generate excess returns is paramount, which ought to be a constructive environment for securities lending market participation.
For more details please join us for the Q1 Securities Finance webinar on Tuesday, April 7th!
S&P Global provides industry-leading data, software and technology platforms and managed services to tackle some of the most difficult challenges in financial markets. We help our customers better understand complicated markets, reduce risk, operate more efficiently and comply with financial regulation.
This article was published by S&P Global Market Intelligence and not by S&P Global Ratings, which is a separately managed division of S&P Global.
{"items" : [
{"name":"share","enabled":true,"desc":"<strong>Share</strong>","mobdesc":"Share","options":[ {"name":"facebook","url":"https://www.facebook.com/sharer.php?u=http%3a%2f%2fstage.www.spglobal.com%2fmarketintelligence%2fen%2fmi%2fresearch-analysis%2fq1-securities-finance-snapshot.html","enabled":true},{"name":"twitter","url":"https://twitter.com/intent/tweet?url=http%3a%2f%2fstage.www.spglobal.com%2fmarketintelligence%2fen%2fmi%2fresearch-analysis%2fq1-securities-finance-snapshot.html&text=Q1+Securities+Finance+Snapshot+%7c+S%26P+Global+","enabled":true},{"name":"linkedin","url":"https://www.linkedin.com/sharing/share-offsite/?url=http%3a%2f%2fstage.www.spglobal.com%2fmarketintelligence%2fen%2fmi%2fresearch-analysis%2fq1-securities-finance-snapshot.html","enabled":true},{"name":"email","url":"?subject=Q1 Securities Finance Snapshot | S&P Global &body=http%3a%2f%2fstage.www.spglobal.com%2fmarketintelligence%2fen%2fmi%2fresearch-analysis%2fq1-securities-finance-snapshot.html","enabled":true},{"name":"whatsapp","url":"https://api.whatsapp.com/send?text=Q1+Securities+Finance+Snapshot+%7c+S%26P+Global+ http%3a%2f%2fstage.www.spglobal.com%2fmarketintelligence%2fen%2fmi%2fresearch-analysis%2fq1-securities-finance-snapshot.html","enabled":true}]}, {"name":"rtt","enabled":true,"mobdesc":"Top"}
]}


