Customer Logins
Obtain the data you need to make the most informed decisions by accessing our extensive portfolio of information, analytics, and expertise. Sign in to the product or service center of your choice.
Customer Logins
BLOG
Aug 06, 2021
Recovery in global trade robust and sustained with limited concerns over the escalating fourth wave (Monthly Global Trade Monitor – July 2021)
Main Observations
- Recovery in the global trade in commodities is ongoing and becoming more sustained and broader; market optimism dominates by now among the top ten economies
- According to official trade statistics published in IHS Markit Global Trade Atlas (GTA), the market-leading bilateral trade research tool, in Q1, exports grew in all the top 10 states year-on-year with the fastest growth in China (+48.6%) followed by Brazil (+15.6%), South Korea (+12.5%), and Canada (+11.6%); in Q2 it grew the fastest year-on-year in Brazil (+52.7%) followed by Japan (+43.1%), South Korea (+42.1%) and China (+30.4%)
- Monthly reported data to show a broad increase in exports in all the top 10 states from March onwards, with a broad recovery in imports starting a month ahead (apart from the UK, affected by the uncertainty over negotiations and the final results of the post-Brexit EU-UK trade agreement)
- Looking from a monthly perspective, Chinese exports are growing consistently from June 2020 onwards (13th month in a row) and imports from September 2020 (11th month in a row)
- On the negative side, the fourth wave of COVID-19 is picking up pace again, driven mainly through the spread of Delta and Delta plus variants and low vaccination rates in particular among emerging and developing states
- The adjusted PMI new exports orders readouts for the global manufacturing industry in July 2021 were above the benchmark value of 50.0 points (52.71) the 11th month in a row; however, it fell month-on-month for the first time in half a year; PMI NExO is pointing to increasing exports in all top 10 economies (apart from Russia) with the highest values for the EU (59.89), the U.S. (54.84), India (54.82) and the United Kingdom (53.92)
- All top 10 are estimated to grow (real GDP) in Q2 and remaining quarters of 2021-22, with the strongest growth impulse in Q2 2021 in the UK (+21.8%), India (19.9%), Canada (+13.5%), the EU (+13.1%), Brazil (+12.7%) and the U.S. (+12.4%) according to the latest results of IHS Markit Global Link Model
Changes in Trade of the Top 10 Economies
- With data steadily incoming from the monthly reporters and included in the Global Trade Atlas (GTA), we are able to look at the complete two quarters of 2021 for some of the top ten economies relative to four quarters of 2020
- Among the top 10 economies, imports went down in 2020 in all the states, similarly in exports, with the only exception of China, in which exports went up by 4.0% relative to 2019; the worst declines in exports overall in Russia (-19.2%), the UK (-15.2%), India (-14.8%) and the U.S. (-13.3%); looking from a quarterly perspective, Chinese exports started to recover already in Q2 2020 and continued to grow throughout the year; the recovery became broader only in Q4 2020 with South Korea, Japan and EU showing positive growth rates yoy
- Recovery in Chinese exports started a quarter later (Q3 2020) and continued, and imports returned to positive figures in the UK, U.S., and Canada in Q4
- Q1 2021 brought a broad recovery in all top 10 economies with the highest yoy growth rate in China and the smallest in Russia, only +0.1% yoy; the figure for China can be explained by the results of Q1 2020 - the initial reaction to the spreading of Covid-19; the same will apply to all other states in Q2 2021 - most adversely affected in Q2 2020 (it will be even more visible from a monthly perspective in the forthcoming tables, a typical statistical base effect)
- In Q2 2021, the growth in exports yoy was the highest in Brazil (+52.7%) followed by Japan (+43.1%) and South Korea (+42.1%); Chinese growth picked in Q1 and was relatively weaker in Q2 (+30.4%); in imports, Q1 brought increases yoy in all the states apart from the UK (-4.2%, potential delayed effect of Brexit) with the most robust expansion in China (+27.3%); in Q2 2021 the yoy growth rates in import were the largest in Brazil (+55.9% yoy) followed by China (+43.7%), South Korea (+37.4%), and finally Japan (+21.5%); recovery in global trade is becoming broader and more sustainable with East Asia region playing the apparent role of a worldwide leader
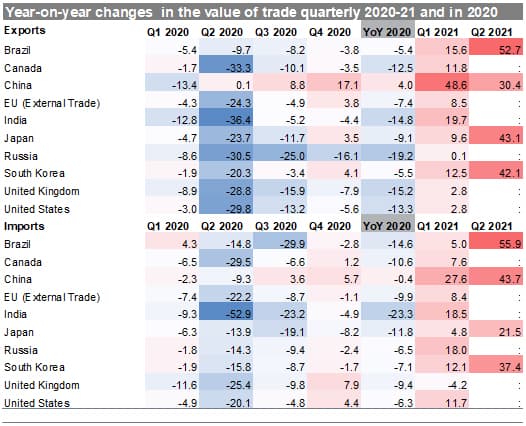
Source: IHS Markit Global Trade Atlas (© 2021 IHS Markit)
- Looking from a monthly perspective, Chinese exports are growing consistently from June 2020 onwards (13th month in a row) and imports from September 2020 (11th month in a row)
- Exports are growing in all the top 10 states from March 2021 onwards, with the situation in the first two months more nuanced; imports, in turn, started growing in all the states a month earlier (Feb 2021) apart from the UK, which showed negative growth rates both in January and February (after increases in November and December 2020 - the primary reason being the uncertainty on the results of negotiations with the EU on after-Brexit trade regulations)
- Generally speaking, the growth rates reported by the top 10 are the highest in the months most adversely affected by the pandemic itself and the initial strict reactions of the affected states in 2020 (mainly January to May) and thus will moderate to lower levels in the later months of Q2 2021 and forthcoming quarters
- The highest yoy growth rates were observed in India in April 2021, both in exports (+201.0% yoy) and imports (+167.2% yoy), the country most adversely affected in April 2020; the base effect is thus apparent and has to be taken into account in the correct interpretation of the data
- The monthly perspective proves the breadth and consistency of the recovery in the global trade of the top 10 economies
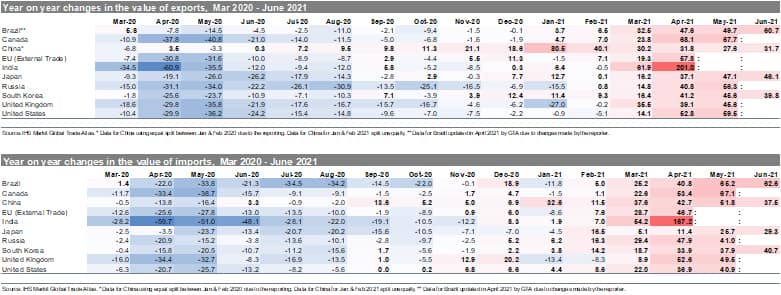
Source: IHS Markit Global Trade Atlas
Prospects for the Forthcoming Months
- The overall impact of COVID-19 on global trade and the global economy will depend on the duration, severity, and spatial distribution of the pandemic and associated severity of containment efforts taken by individual states
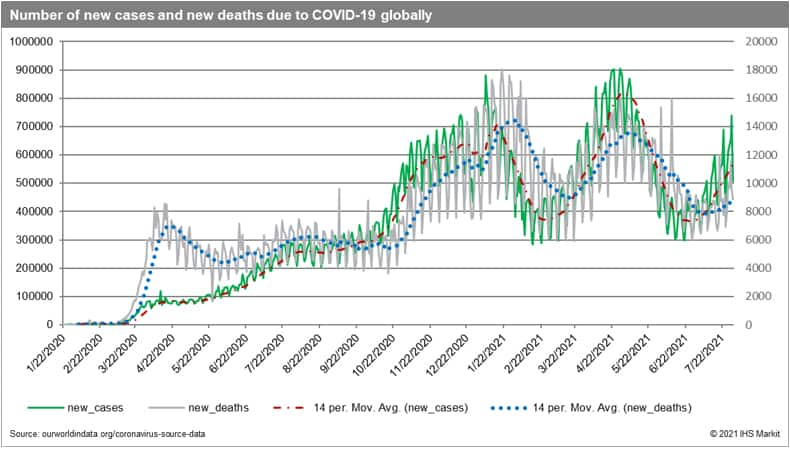
- The cumulative number of confirmed cases of COVID-19 globally by 31 July 2021 reached 198.3 million and 4.23 million deaths. The cumulative number of cases is the largest in Asia (62.3 million), Europe (51.9 million), North America (41.8 million), and South America (35.5 million); looking from the individual country perspective, the cumulative number of cases is the highest in the U.S. (35.0 million), India (31.7 million), Brazil (19.9 million)
- In July 2021, COVID-19 was spreading the fastest in Brazil (1.36 million cases), the USA (1.31 million cases), India (1.24 million new cases), Indonesia (1.24 million cases), and the UK (1.06 million). The top 10 countries affected included as well Russia, Iran, Spain, Columbia, and South Africa; the highest death toll in July 2021, in turn, was observed in Brazil, Indonesia, India, Russia, & Columbia
- The 2-week moving averages of global new cases and deaths stopped to decline in June and started rising again in July, with global average death rates following with a two-week delay; it seems that the fourth wave is unavoidable with some countries reintroducing stricter restrictions (including lockdowns, e.g., Australia)
- The reported number of vaccinations globally reached 4.25 billion with 1.16 billion people fully vaccinated, which is equivalent to 14.8% of the global population (still far from the worldwide herd immunity threshold); the process of vaccination is picking up the pace; however, inequalities abound, 23 countries or territories report by now the vaccination rate with two doses above of 60% - with the highest vaccination rates reported in Gibraltar (99.0%), Malta (76.6%), Kaiman (73.8%), UAE (71.9%), Island (71.3%), Isle of Man (70.8%) and Seychelles (70.2%)
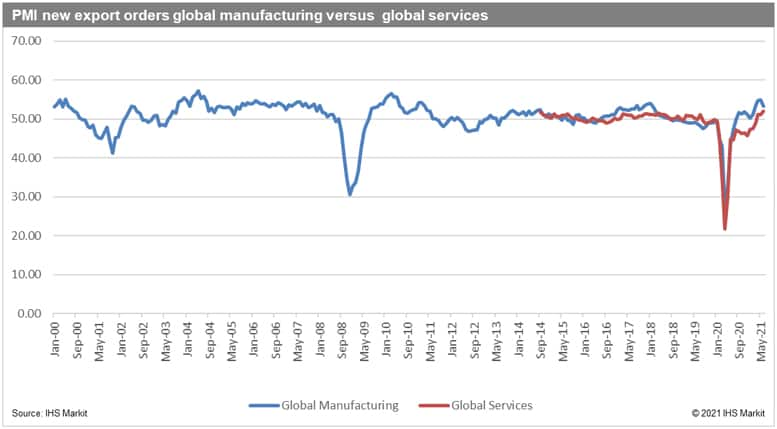
- The adjusted PMI new exports orders (PMI NExO) readouts for the global manufacturing industry in July 2021 were above the benchmark value of 50.0 points (52.71) the 11th month in a row. It is pointing to increasing exports in all top 10 economies (apart from Russia, values below the benchmark 2nd month in a row) with the highest values for the European Union (59.89), the U.S. (54.84), India (54.82), and the United Kingdom (53.92)
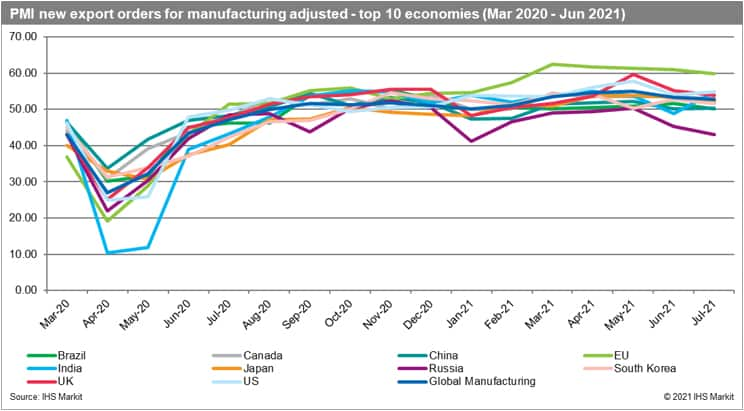
- Both PMI NExO for global manufacturing (53.25) and global services (51.17) are above the 50.0 points the third month in a row, making a recovery in the global economy ever more sustainable; PMI NExO for global services is growing the 6th month consistently in a row, the manufacturing PMI NEx0 decreased for the first time (in comparison to May 2021 readout) in half a year
- The most recent real GDP growth forecasts from IHS Markit were published on 15 July 2021 and are based on the baseline scenario of the impact of COVID-19 on the global economy
- The estimated contraction in real global GDP is 3.5% in 2020, varying between -4.6% for advanced, -1.6% for emerging, and -5.7% for the most affected developing economies
- We foresee a global recovery in 2021, with year-on-year real GDP growth rates predicted to reach 5.8% (-0.2% adjustment over the last month estimate). The growth rates are expected to vary between 5.4% (4.3% in 2022) for advanced, 6.5% (5.1%) for emerging, and 5.1% (4.9%) for developing states (the growth rate for advanced states has been lowered in comparison to prior release)
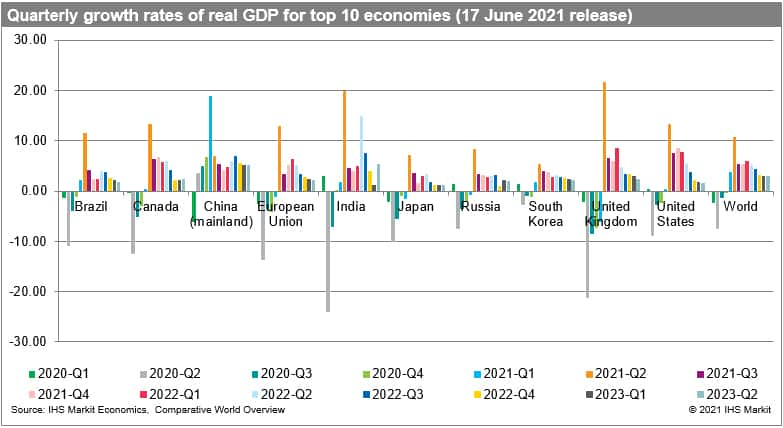
- Real global GDP contracted in every single quarter of 2020, with Q2 being the worst quarter. The estimated growth rate in Q1 2021 was 3.9% and varied between -0.2% for advanced and 10.1% for emerging economies. In Q2 2021 real global GDP is estimated to have grown by 10.6%, with the growth impulse stronger for advanced (12.2%) than emerging economies (8.1%). The prospects for Q3 and Q4 are positive, with growth rates moderating to 5.0% and 5.1%, with recovery stronger in advanced economies (the forecasts have been lowered in comparison to the June 2021 release of GLM data)
- Recovery in China started in Q2 of 2020 following the COVID-19 related contraction in the first quarter. Apart from China (+18.7%), five other economies out of the top 10 group are now estimated to have grown in real terms in Q1 2021. These are Brazil (+2.3%), Canada (+0.3%), South Korea (+1.9%), India (+1.7%) and the U.S. (+0.4%)
- All top 10 are estimated to grow in Q2 and remaining quarters of 2021-22, with the strongest growth impulse in Q2 2021 in the UK (+21.8%), India (19.9%), Canada (+13.5%), the EU (+13.1%), Brazil (+12.7%) and the U.S. (+12.4%)
This column is based on data from IHS Markit Maritime & Trade Global Trade Atlas (GTA) & GTA Forecasting.
For more details about Global Trade Atlas Forecasting please visit the product page
https://ihsmarkit.com/products/gta-forecasting.html
For more details about Global Trade Atlas (GTA) please visit the product page
https://ihsmarkit.com/products/maritime-global-trade-atlas.html
The full version of this article is available on the Connect platform for IHS Markit clients with a subscription to GTA/GTA Forecasting or GTAS Suite
*Please note that China (mainland) reported an aggregated value of trade for January-February 2020 and 2021 - for the year 2020 the data in the GTA database were equally split between the two months, while for 2021 the data were split unequally.
Please note that Brazil has revised data for 2020 affecting the reported growth rates (please be careful not to compare the current GTM Report with prior editions due to significant changes)
Subscribe to our monthly newsletter and stay up-to-date with our latest analytics
{"items" : [
{"name":"share","enabled":true,"desc":"<strong>Share</strong>","mobdesc":"Share","options":[ {"name":"facebook","url":"https://www.facebook.com/sharer.php?u=http%3a%2f%2fstage.www.spglobal.com%2fmarketintelligence%2fen%2fmi%2fresearch-analysis%2frecovery-in-global-trade-robust-and-sustained-limited-concerns.html","enabled":true},{"name":"twitter","url":"https://twitter.com/intent/tweet?url=http%3a%2f%2fstage.www.spglobal.com%2fmarketintelligence%2fen%2fmi%2fresearch-analysis%2frecovery-in-global-trade-robust-and-sustained-limited-concerns.html&text=Recovery+in+global+trade+robust+and+sustained+with+limited+concerns+over+the+escalating+fourth+wave+(Monthly+Global+Trade+Monitor+%e2%80%93+July+2021)+%7c+S%26P+Global+","enabled":true},{"name":"linkedin","url":"https://www.linkedin.com/sharing/share-offsite/?url=http%3a%2f%2fstage.www.spglobal.com%2fmarketintelligence%2fen%2fmi%2fresearch-analysis%2frecovery-in-global-trade-robust-and-sustained-limited-concerns.html","enabled":true},{"name":"email","url":"?subject=Recovery in global trade robust and sustained with limited concerns over the escalating fourth wave (Monthly Global Trade Monitor – July 2021) | S&P Global &body=http%3a%2f%2fstage.www.spglobal.com%2fmarketintelligence%2fen%2fmi%2fresearch-analysis%2frecovery-in-global-trade-robust-and-sustained-limited-concerns.html","enabled":true},{"name":"whatsapp","url":"https://api.whatsapp.com/send?text=Recovery+in+global+trade+robust+and+sustained+with+limited+concerns+over+the+escalating+fourth+wave+(Monthly+Global+Trade+Monitor+%e2%80%93+July+2021)+%7c+S%26P+Global+ http%3a%2f%2fstage.www.spglobal.com%2fmarketintelligence%2fen%2fmi%2fresearch-analysis%2frecovery-in-global-trade-robust-and-sustained-limited-concerns.html","enabled":true}]}, {"name":"rtt","enabled":true,"mobdesc":"Top"}
]}


