Customer Logins
Obtain the data you need to make the most informed decisions by accessing our extensive portfolio of information, analytics, and expertise. Sign in to the product or service center of your choice.
Customer Logins

EQUITIES COMMENTARY
Sep 06, 2022
Securities Finance August Snapshot 2022

- Securities finance revenues remain strong during August
- Americas equity revenues increase 66% YoY
- Corporate bonds experience strongest revenues of 2022 yet again
- ADR revenues start to recover
Despite August traditionally being a quiet month for securities finance activity, global securities financing revenues hit $1.139bln during the month. This was the highest revenue generating month of the year after July set the previous high of $1.125bln. Revenues increased 27% YoY across all asset classes combined with double digit increases across the vast majority of sectors. Asset classes to note when revenues are compared with August 2021 are Americas Equities (+66% YoY), ADRs (+88% YoY) and corporate bonds (+89% YoY).

Americas
As the Fed stated that monetary policy would be remaining tight for "some time", that they would be using their tools "forcefully" and that "some pain would be inflicted" to deal with inflation, equity markets were sent lower, after recent gains, leading to a volatile trading environment throughout the month. The S&P 500 fell 4.2% towards the end of August bringing its YTD return to -17.02%. Securities finance revenues offered a silver lining however with a 66% increase YoY. Average balances were up 10% YoY, average fees were up 51% YoY and average utilisation was up 16% YoY. MoM the data was less impressive showing a decrease in monthly revenues of 18% however.
As referenced throughout the month by the Securities Finance Team via the S&P Market Intelligence linkedin page, the meme stock phenomenon made a return during the month of August. BBBY, AMC and GME all featured heavily in the press as the possibility of a renewed short squeeze due to an increase in their share prices reappeared. Some of these stocks appear in the top 10 highest revenue generating stocks for the month of August. GME generated monthly revenues exceeding $40m, producing more than $188m in securities financing revenues over the course of 2022. Many of the other names in the top ten revenue generators remained unchanged when compared to the previous months. Automobile component companies, consumer services and the media and entertainment sectors continued to dominate demand. The top ten revenue generating stocks accounted for 33% of all Americas revenues.

APAC equities
APAC equity revenues decreased 11% YoY but were down a modest 4% when compared with July.
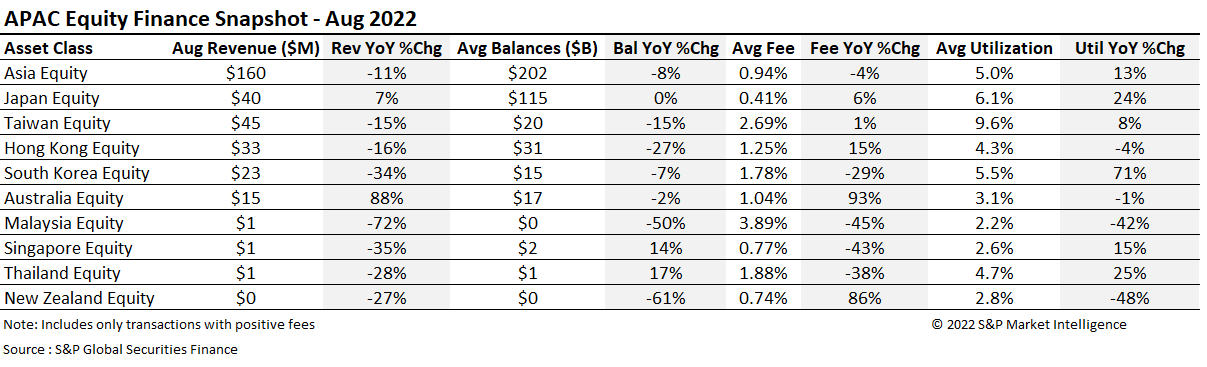
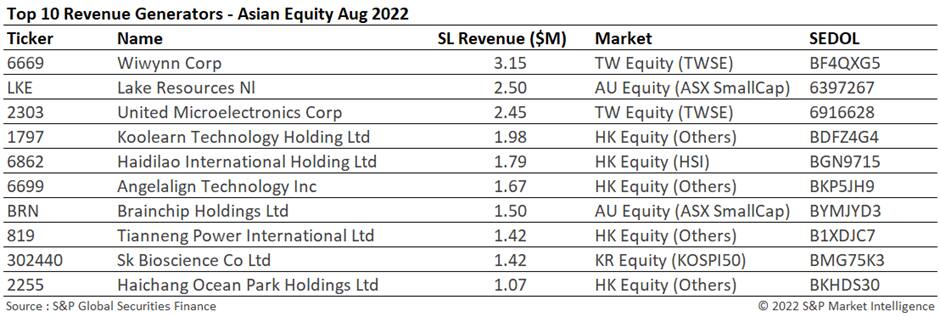
Taiwan was the top earning market once again generating $45m of revenues which equates to 28% of all revenues for the region. Taiwan continues to lead in the top ten revenue generator table as well, as a new edition, Wiwynn Corp, became the top revenue generating stock for August. Supply chain dislocations tied with production issues (it takes an average of 26 weeks to make a semiconductor) are keeping several Taiwanese stocks in the "specials" space. This is reflected in utilisation figures which show a 9.6% increase YoY.
Revenues in Japan increased by 7% YoY with average balances remaining flat YoY. Average fees and utilisation also increased. Investor sentiment improved in Japan during the month. This was reflected by a rising stock market and a return to an inflationary environment after years of deflation.
Australia generated 88% more revenue during August 2022 when compared with August 2021. Mining and energy stocks are particularly popular given the current energy crisis caused by the boycott of Russian energy in Europe and the US. Average fees increased an impressive 93% in this market which reflects the strength of interest shown in borrowing Australian equities.
Other markets to note in the APAC region include South Korea and Hong Kong. Revenues were down in both markets YoY. This is reflective of the review of short selling activity in South Korea and the fall in investor sentiment due to China's zero COVID policy in Hong Kong.
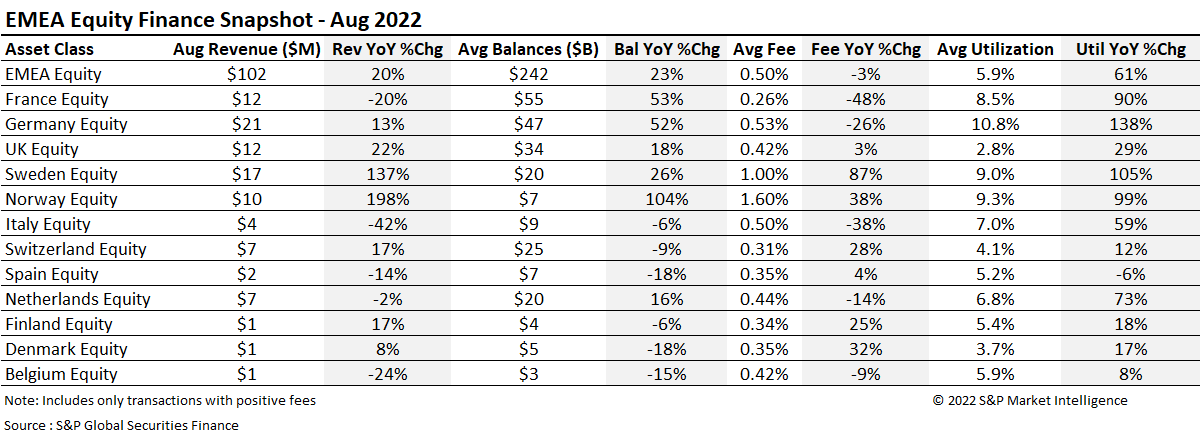
EMEA equities
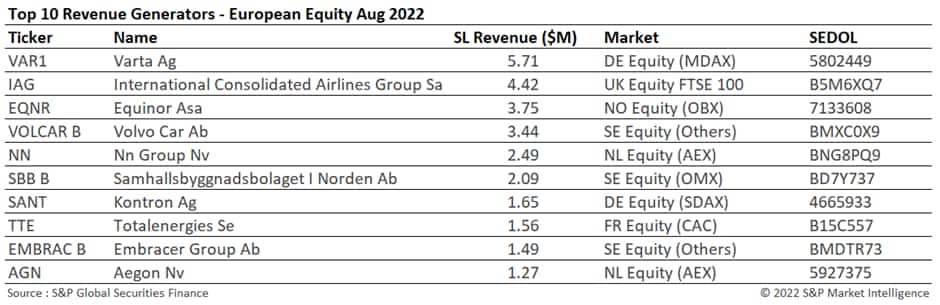
Securities finance revenues in EMEA equities generated $102m during the month of August. The highest revenues were generated by German equities during the month, increasing 13% YoY. Norwegian and Swedish equities were very much in focus throughout the month with revenue increases of 198% and 137% respectively. Equinor Asa contributed to 37% of Norway's monthly revenues alone after a sharp decrease in expected profits caused speculators to short the stock.
Average balances saw notable increases across all EMEA markets apart from Denmark, Spain, Switzerland, Italy and Belgium. Outside of the Nordics, both Germany and France saw double digit increases of 52% and 53% YoY respectively. Utilisation also hit 10.8% in Germany and 8.5% in France as the economic impact of the European energy crisis started to be reflected in the stock prices of the largest companies, fuelling demand to borrow. Utilisation across all EMEA markets increased 61% YoY. Average fees fell 3% YoY however. Demand for European equities is increasing but given the lack of widespread "specials" over the last few years, the increase in demand is not yet translating into substantially higher revenues and fees. Compared to July, revenues in the EMEA region remained steady.
The top ten revenue generating stocks for the EMEA region remained similar to those seen during July. There were new additions from the insurance and energy sectors. Nn Group was a new addition after a 12.1% fall in YoY profit figures due to the sale of its asset management arm and insurance costs linked to a recent storm in the Netherlands and Aegon, another Dutch insurer, was also affected by the same insurance claims. The energy sector remains under pressure due to higher gas and electricity prices spurred by the cessation of Russian energy within the European countries.
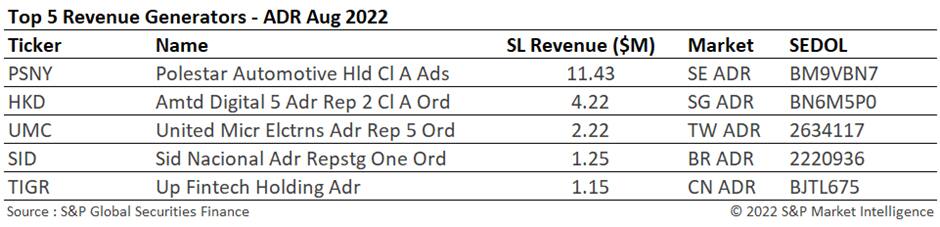
ADRs
ADRs saw a recovery in revenues during the month of August. Revenues increased 88% YoY and 25% MoM. Revenues for August of $40m were the highest of 2022 so far. Revenues for the asset class have been slowly increasing over the year with August doubling those of January. In line with revenues, average fees at 1.67% were also the highest of the year so far increasing 168% YoY and 28% MoM.
The top five revenue generating ADRs for the month of August were dominated by Polestar and AMTD which accounted for 40% of all revenues. Polestar remains under pressure from supply chain issues and AMTD continues to be heavily borrowed as the stock remains in its post-IPO lock up period.
With the expectation of an agreement this month between the US and China regarding listing Chinese stocks on the NYSE, the demand for ADRs is expected to increase as investors become less cautious about investing in the sector and investment opportunities increase.
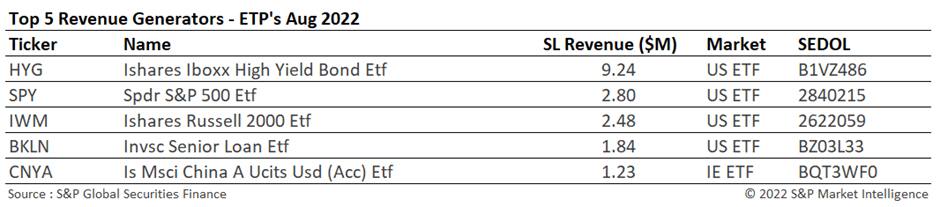
ETPs
Securities finance revenues generated by ETPs, despite increasing 18% YoY, suffered their worst month since January. Both American and European ETFs showed strong increases in revenues YoY and strong increases in Fees YoY, despite utilisation being down across all regions. American ETPs continued to dominate the revenue table producing 83% of all revenues.
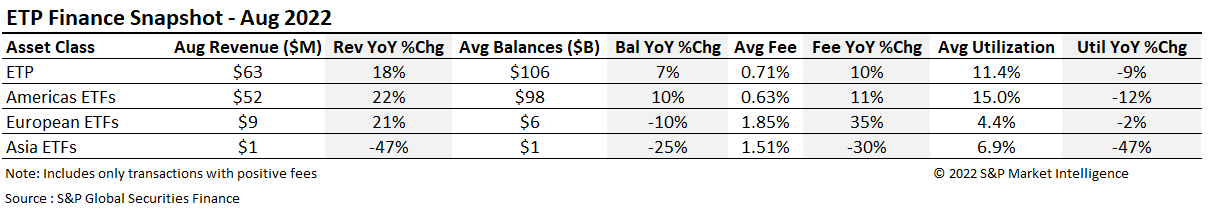
The top revenue generators remain consistent with previous months as the market volatility produced the same requirements for both delta hedging and index shorts. Demand for HYG increased over the month with revenues in this name alone increasing 41% when compared with July.
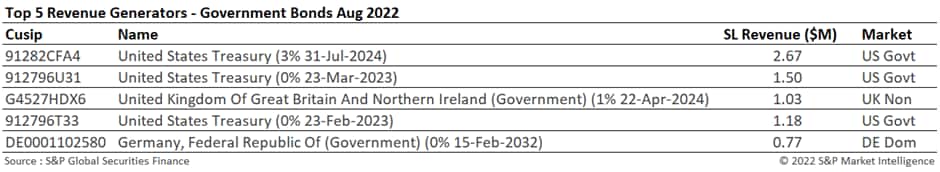
Government Bonds
Interest rate policy continued to set the tone regarding the shorting of short-dated government bonds as the asset class saw the highest revenues of the year so far generating $156m during the month. Average fees continued to increase YoY despite average balances and utilisation being down. Short-dated UK Gilts and US Treasuries saw the highest demand with the 3%July24 US Treasury taking the top spot.
Demand for government bonds is expected to increase further throughout the year due to the implementation of Phase 6 of UMR, a general flight to quality as equity markets remain volatile and the requirement by corporations to fulfil their growing collateral requirements at CCP's. An expected increase in demand coupled with the steady increase in average rates should provide a favourable backdrop for increasing revenues throughout the rest of 2022.
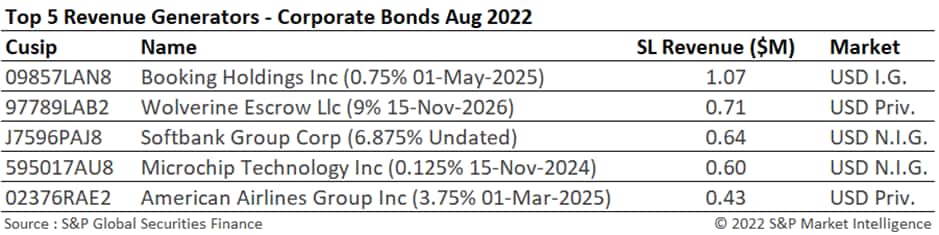
Corporate bonds
Corporate bonds experienced another pinnacle as monthly revenues reached $87m. August was the highest revenue generating month for the asset class so far this year. Demand continued to grow as pressure on bond prices grew as interest rates increases became a reality and calls for more aggressive rises gain traction. Those companies that are low on liquidity or looking to refinance are being actively shorted along with the non-investment grade and high yield sectors more generally.
Revenues increased a whopping 89% YoY, balances were up 9%, fees were up 73% and utilisation was up 26%. As demand for the asset class has increased over the year so have average fees. Average fees have increased 31% so far during 2022.
The top five revenue generating bonds contributed only 4% of all revenues for the month. Booking Holdings was a new addition following a disappointing earnings report.
Conclusion
Securities finance activity remained buoyant during August which is traditionally seen to be a quieter month due to summer holidays in the northern hemisphere. Revenues were on par with those generated during the month of July which was the best month of 2022 so far. All regions improved in terms of revenue generation when compared YoY. When compared with July, Government bonds and ADRs saw increases in revenues throughout the month.
As market conditions remain volatile, securities finance revenues are expected to remain strong. Further increases in loan balances are expected and the pool of assets offering high fees and high utilisation is predicted to grow.
As central bank policy around the world remains committed to monetary tightening, corporate bonds are expected to remain attractive to borrowers and equity markets are expected to remain volatile. Despite inflationary pressures, company results remain healthy. As long as this remains the case, quant, global macro and arbitrage funds should continue to see value in borrowing stocks to fulfil their trading strategies.
S&P Global provides industry-leading data, software and technology platforms and managed services to tackle some of the most difficult challenges in financial markets. We help our customers better understand complicated markets, reduce risk, operate more efficiently and comply with financial regulation.
This article was published by S&P Global Market Intelligence and not by S&P Global Ratings, which is a separately managed division of S&P Global.
{"items" : [
{"name":"share","enabled":true,"desc":"<strong>Share</strong>","mobdesc":"Share","options":[ {"name":"facebook","url":"https://www.facebook.com/sharer.php?u=http%3a%2f%2fstage.www.spglobal.com%2fmarketintelligence%2fen%2fmi%2fresearch-analysis%2fsecurities-finance-august-snapshot-2022.html","enabled":true},{"name":"twitter","url":"https://twitter.com/intent/tweet?url=http%3a%2f%2fstage.www.spglobal.com%2fmarketintelligence%2fen%2fmi%2fresearch-analysis%2fsecurities-finance-august-snapshot-2022.html&text=Securities+Finance+August+Snapshot+2022+%7c+S%26P+Global+","enabled":true},{"name":"linkedin","url":"https://www.linkedin.com/sharing/share-offsite/?url=http%3a%2f%2fstage.www.spglobal.com%2fmarketintelligence%2fen%2fmi%2fresearch-analysis%2fsecurities-finance-august-snapshot-2022.html","enabled":true},{"name":"email","url":"?subject=Securities Finance August Snapshot 2022 | S&P Global &body=http%3a%2f%2fstage.www.spglobal.com%2fmarketintelligence%2fen%2fmi%2fresearch-analysis%2fsecurities-finance-august-snapshot-2022.html","enabled":true},{"name":"whatsapp","url":"https://api.whatsapp.com/send?text=Securities+Finance+August+Snapshot+2022+%7c+S%26P+Global+ http%3a%2f%2fstage.www.spglobal.com%2fmarketintelligence%2fen%2fmi%2fresearch-analysis%2fsecurities-finance-august-snapshot-2022.html","enabled":true}]}, {"name":"rtt","enabled":true,"mobdesc":"Top"}
]}