Customer Logins
Obtain the data you need to make the most informed decisions by accessing our extensive portfolio of information, analytics, and expertise. Sign in to the product or service center of your choice.
Customer Logins
EQUITIES COMMENTARY
Mar 08, 2021
Securities Finance February 2021
- February revenues increased by 10% YoY
- US equity special balances pull back
- Futu Holdings led ADR revenue surge
- New record for ETP loan balances
Global securities finance revenues totaled $812m in February, a 10% YoY increase. Average daily global revenues decreased 8% MoM compared with January. The primary contributor to the revenue declining compared with January was decreasing US equity special balances, coming on the heels of the short squeeze in January. The decline in US equity special balances was partly offset by increasing APAC special balances, both locally listed as well as ADRs. In this note we will review revenue drivers from February, which combined with January to put YTD revenues 18% ahead of the first two months of 2020.

APAC Equity
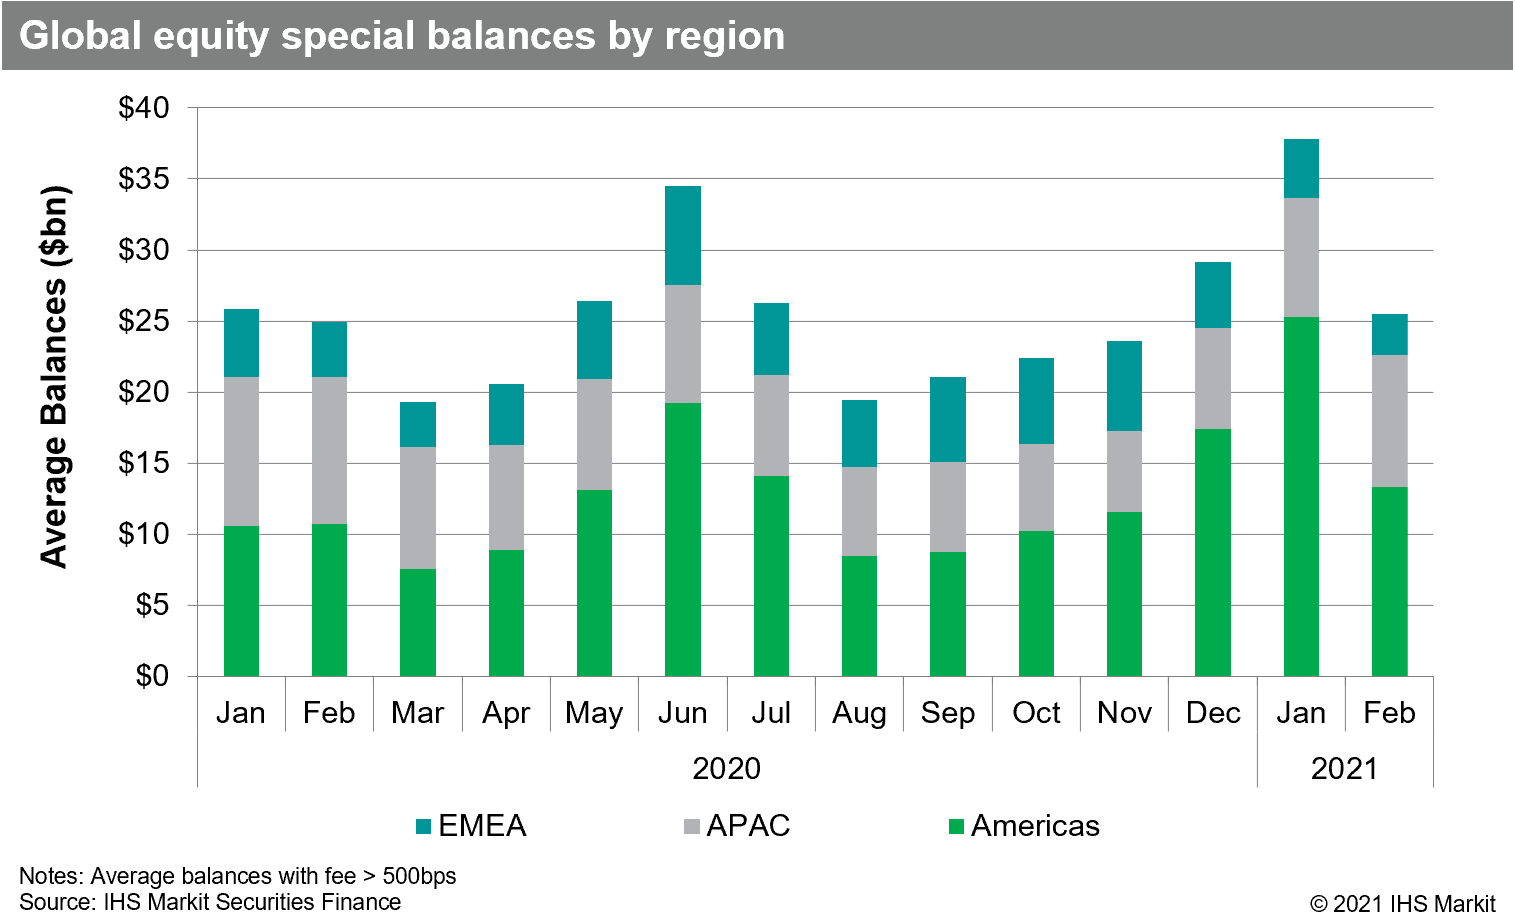
APAC equity finance revenues declined 8% YoY in February, the 13th consecutive month of YoY declines. Average daily revenues increased 7% compared with January, the fourth consecutive month where daily returns increased MoM. Asia equity special balances continue the recovery from the 2020 low point in early November, with February's $9.2bn in daily average special balances being the most for any month since February 2020. Special balances are defined in this note as balances with a fee greater than 500bps.

The largest market, Japan equities, delivered $42m in February revenues, a decline of 14% YoY, however daily average revenues increased 5% MoM. Hong Kong equity finance revenues increased by 60% YoY in February, the fifth consecutive month with increasing daily average revenue. Apart from Malaysian firm Top Glove Corporation, HK equities owned the top of the revenue generation leader board. The short sale ban in South Korea continues to limit lending revenue, with $6.4m in February revenue reflecting an 83% YoY decline. South Korea's Financial Services Commission (FSC) has extended its short selling ban until May 2nd.
Depository Receipts
Revenues from lending American Depository Receipts (ADRs) increased 549% YoY. Most of the increase was driven by Hong Kong SAR domiciled Futu Holdings, which generated $94m in February, 75% of the total ADR return. While Futu dominated February returns, and represented a third of January revenues, there is a broader demand narrative taking shape. Excluding the impact of Futu, February ADR revenues increased 65% YoY.

Apart from Futu's impact on HK ADR revenues, ADRs for Mainland Chinese firms also contributed to revenue growth in February, with $20.4m in revenue reflecting an 80% YoY increase. European ADRs delivered $4.8m in February revenue, an 8.9% YoY decrease. Depository receipts listed outside the US generated $5.1m in February, a 74% YoY increase.
Americas Equity
Americas equity revenues came in at $290m for February, a 7% YoY decline and a 33% decrease in average daily revenue compared with January. The MoM decline was largely the result of declining special balances, reflected in weighted average fees increasing 31% MoM, while loan balances only decreased by 2% MoM.
US equity revenues came in at $266m for January, a 7% YoY increase. Given the soaring January revenues for US equities, set against the broad squeeze for crowded shorts, it was not surprising to see some decline in special balances in February. US equity special balances declined by 48% MoM, with an average of $13bn in February, following January's $25bn average.
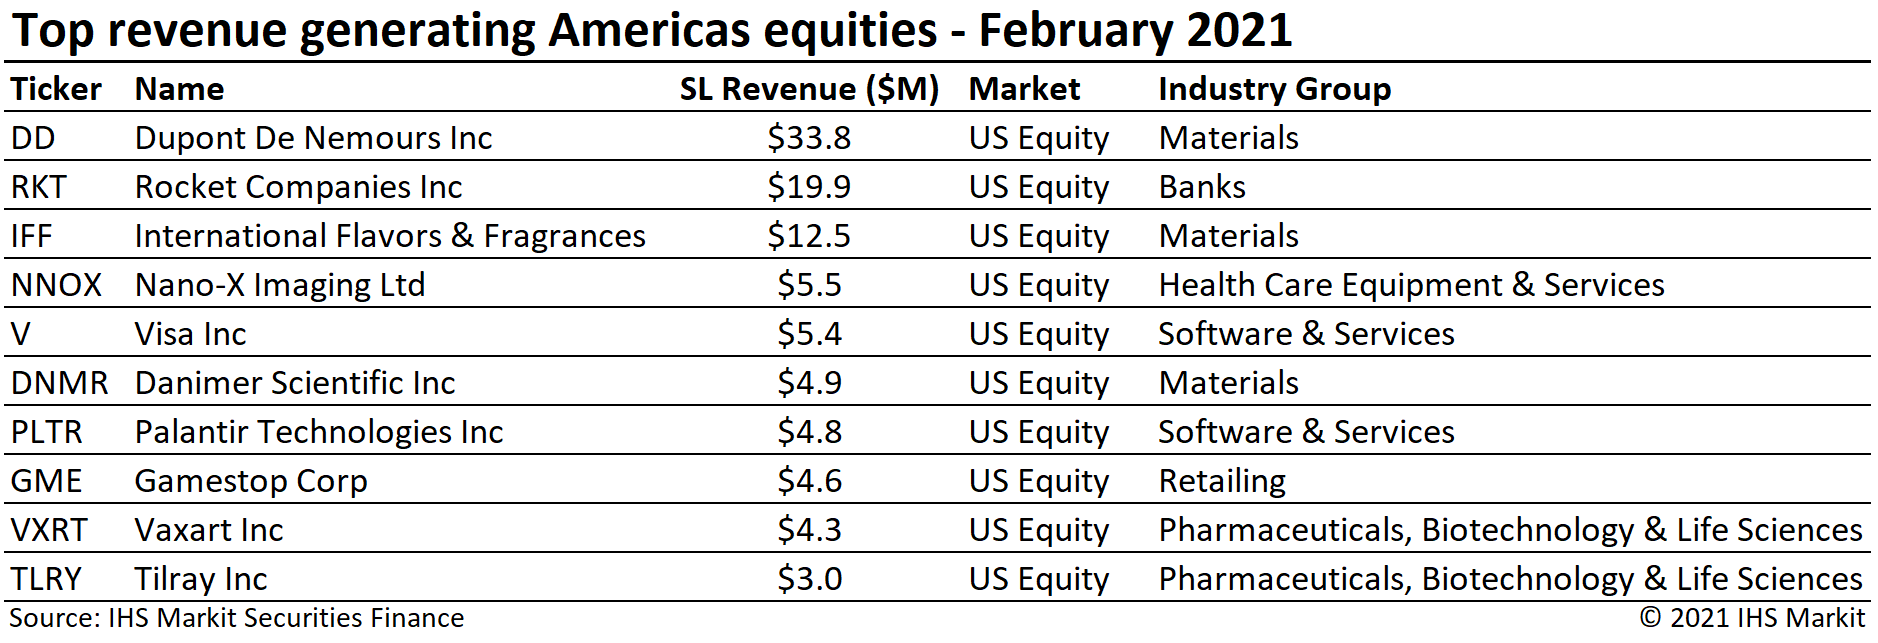
The highest revenue generating US equity in January 2021 was DuPont De Nemours Inc (DD) with $33.8m, driven by the exchange offer for International Flavors & Fragrances Inc (IFF). The borrow demand for DD shares was most likely driven by arbitrageurs who purchased DD shares with the intent to tender and then used equity derivatives to hedge the portion of the shares which they thought were unlikely to be accepted in the exchange offer. The final proration factor of 52.53% means that just over half of the shares tendered were accepted, or 197m shares out of the 360m shares tendered. That leaves 163m shares tendered but not accepted, a large portion of which were likely hedged with options which were in turn hedged by borrowing shares and shorting them (shares on loan peaked at 132m shares on Feb 2nd). The trade also drove borrow demand for IFF shares, as arbitrageurs likely hedged a portion of the shares which would be accepted to lock in the discount in the offer, however there was some friction with borrow availability given that the shares in the exchange offer more than doubled the IFF shares outstanding.
Utilizing the IHS Markit Situational Analytics dataset we aggregated current and former SPAC IPOs to look at the impact on equity finance revenues. The 2020 vintage of SPAC IPOs generated $16.2m in February, led by Danimer Scientific Inc, which generated $4.9m in February revenue. Revenues for all former SPAC IPOs, since the start of 2017, totaled $32.5m in February, down from $76m in January.
Canadian equity lending revenue of $23m reflected a 62% YoY decline. The YoY decline was primarily driven by a 60% decline in average fees, though balances did also decline slightly YoY. Average daily CA equity revenue increased 12% MoM. Canadian equity specials balances averaged just over $613m for February, a 1.2% increase compared with January.
European Equity
European equity returns declined by 17% YoY for February, with $77m in monthly revenue. Daily average revenue declined by 24% MoM compared with January.

German equity finance revenues of $12.7m were the lowest for any month since January 2019, following a stellar run of returns which began with increasing revenue for Wirecard and Deutsche Lufthansa in the first half of 2020. Varta Ag returns increased steadily over 2020 and peaked in January 2021, before borrow demand cratered in the January squeeze. Average daily German equity finance revenues declined by 59% in February as compared with January.
EMEA specials balances declined by 30% MoM, with February special balances of $2.9bn. It could be said there was a Varta-sized hole in the comparison of February and January revenues, however special balances still would have declined by 20% MoM excluding the impact of the German battery manufacturer, reflecting a broader decline.
Exchange Traded Products
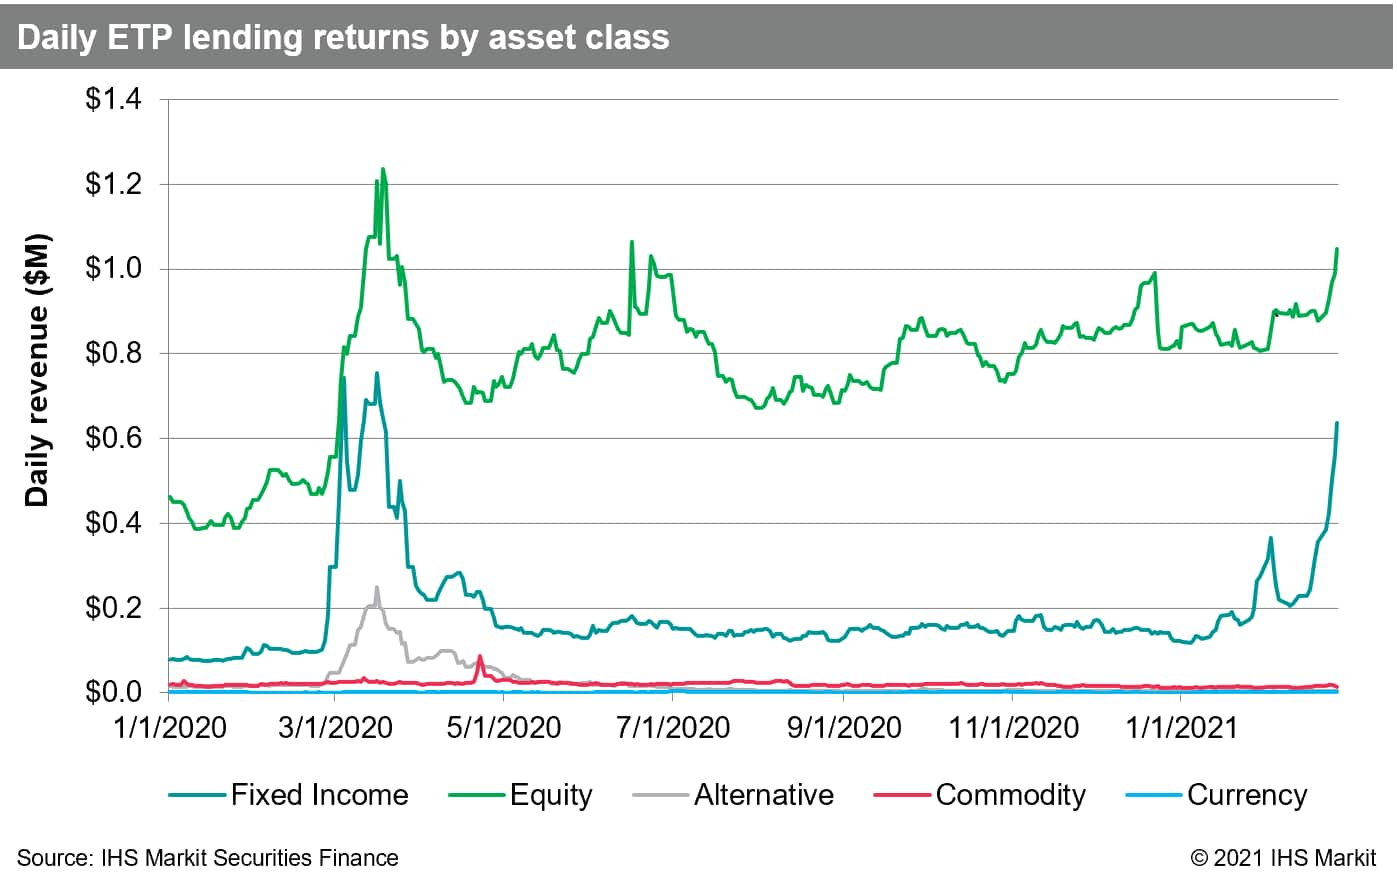
Global ETP revenues totaled $39m for February, a 74% YoY increase and the largest monthly revenue total since March 2020. Loan balances increased by 52% YoY, the largest contributor to revenue growth, however average fees also increased 19% YoY. Loan balances reached a new all-time high on February 25th, narrowly edging out the prior record set in December.

The uptick in borrow demand for the iShares iBoxx $ High Yield Corporate Bond ETF (HYG), noted in the January revenue snapshot, followed through into February, making the fund the most revenue generating exchange traded product of the month. Revenues for lending all fixed income products increased by 78% MoM, with $9.3m in February revenue. Average daily equity ETP revenues increased 24% MoM and the percentage contribution from fixed income products increased from 16% in January to 26% in February.
Corporate Bonds
Corporate bond lending returns came in at $31.6m for January, a 21% decline YoY. The long-run decline in corporate bond lending revenues, starting at the post-GFC peak return in late-2018, is showing signs of reversing course. Average daily revenues in February increased 4% MoM, with $1.1m in daily revenue the most for any month since July 2020. Average monthly loan balances extended the climb from the 2020 low-point in September, $172bn, with February average positive-fee balances of $212bn the most for any month since August 2011. The Diamond Sports Group LLC 6.625% note due August 2027 regained the title of most revenue generating issue in February, a spot the issue last held in Q1 2020.

Government Bonds
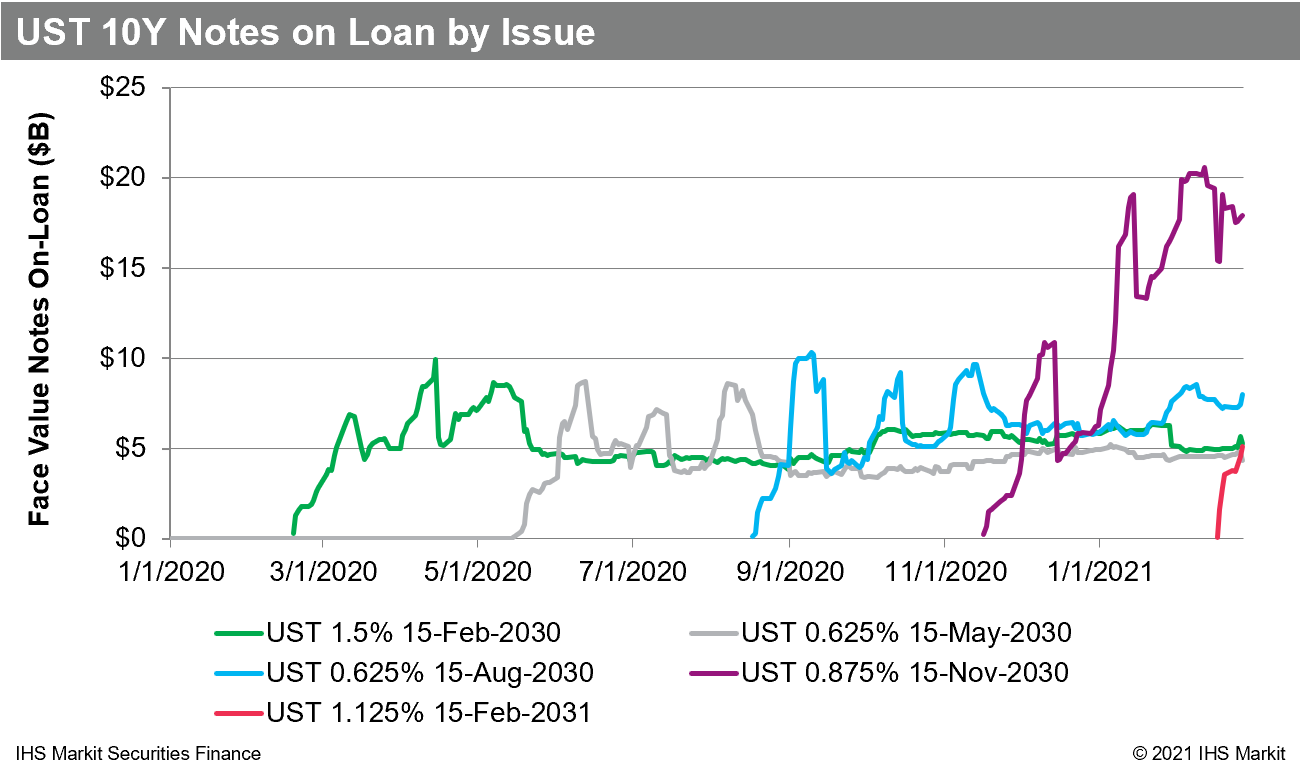
Government bond borrow demand remains robust, with just over $1T in positive-fee global balances for February reflecting a 23% YoY increase. February was the first month since September 2020 to see a MoM decline in average balances, however part of the decline was the result of declining bond prices as rates increased. Revenues totaled $114m in February, an 8% YoY increase. US government bond lending revenue came in at $68m for February, an 18% YoY increase. The most revenue generating bond was the 10Y due Nov 2030, which saw increased loan balances, however fees remained subdued as compared with the days leading up to the 10Y auction on Jan 14th. The newly issued UST 10Y due Feb 2031 saw balances increase along with elevated fees as expected, however the contribution to February returns was limited. Returns from lending European sovereigns were $36m for February, a 2.7% YoY decrease, the first YoY decline since November 2020.
Conclusion
2021 has delivered new securities finance revenue catalysts, including increased borrow demand for the UST 10Y, surging specials balances amid the January short squeeze, fixed income ETF shorts, APAC ADRs and the corporate action related demand for DuPont shares. Demand drivers from 2020 have also persisted, namely the nascent recovery in APAC specials balances and borrow demand related to capital raising from IPOs to SPACs to convertible bonds. It's been a solid start to 2021 from a securities finance revenue perspective and with dividend reinstatement and the conclusion of remaining short sale bans in sight, in addition to pipeline of IPOs and SPACs with lockup expiries, the outlook is bright heading into March. The SPAC boom also expanded beyond North America in February, with two European listed blank check companies raising a combined $634m.
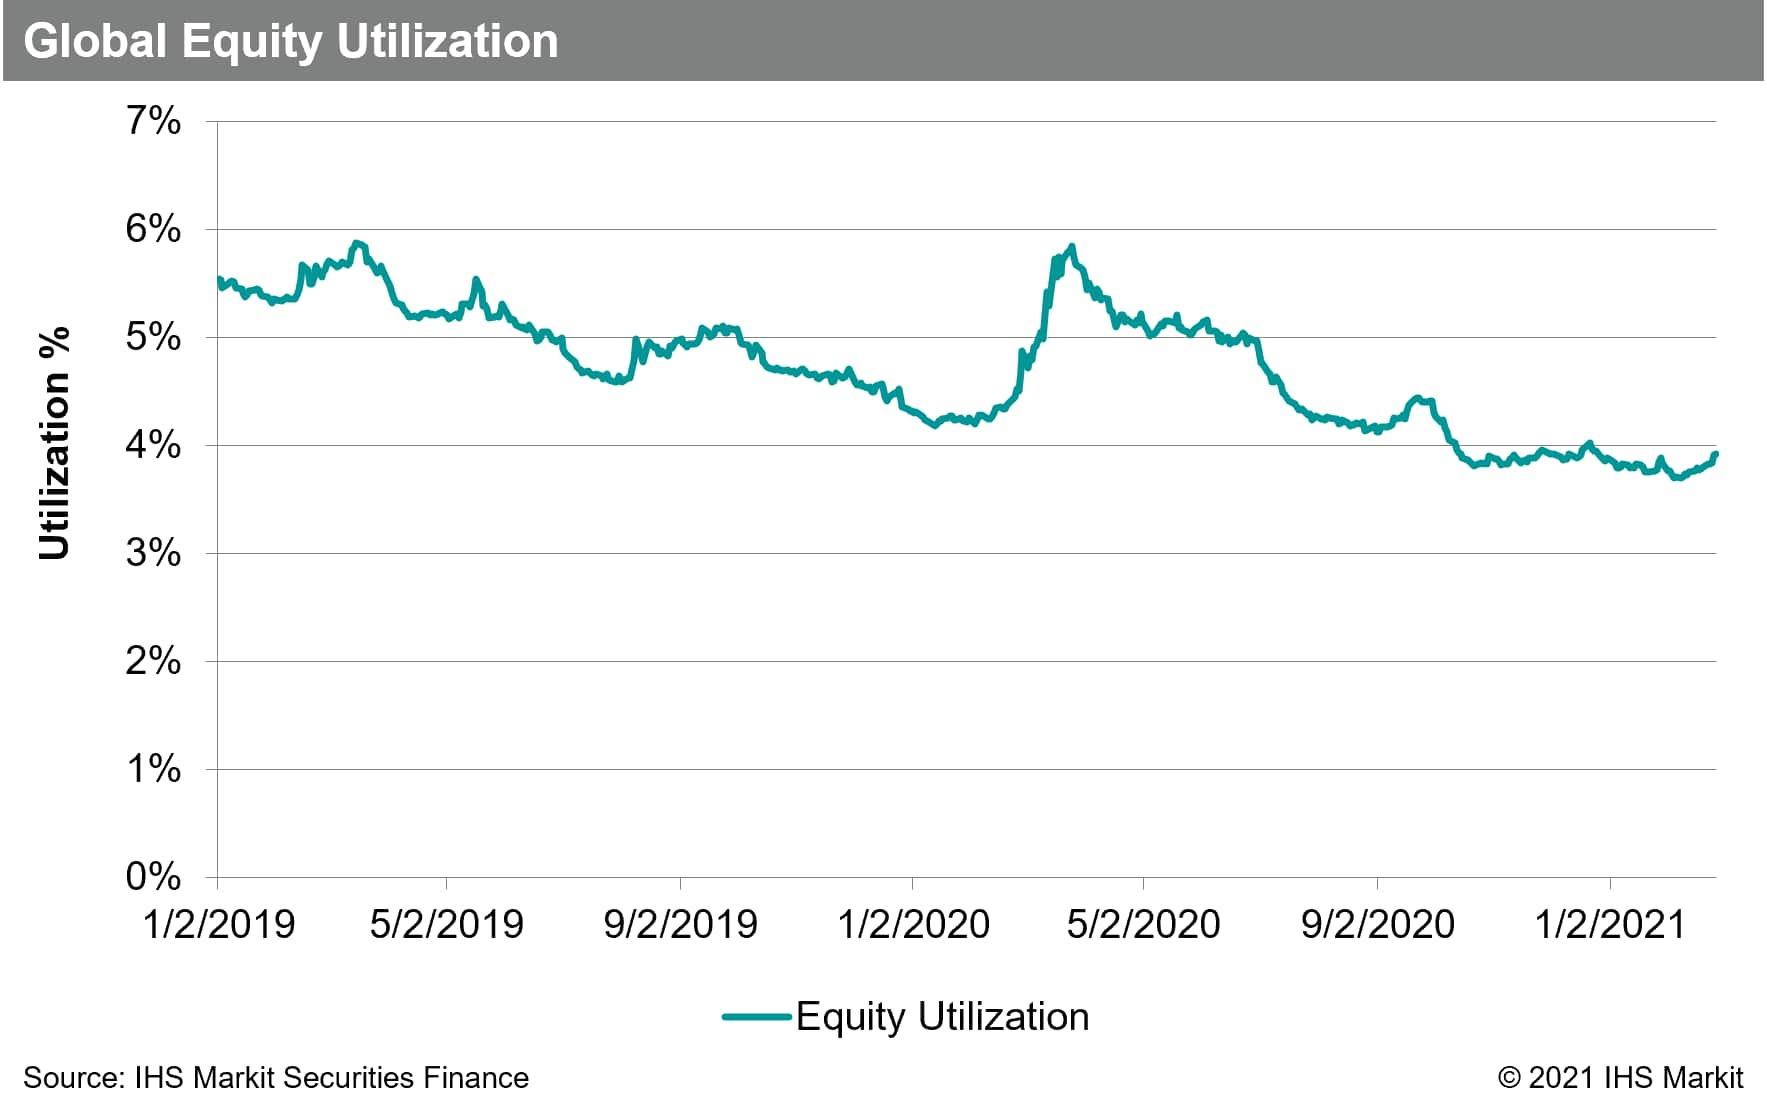
Despite robust borrow demand, the first two months of 2021 have not seen an increase in equity utilization, which has averaged 3.8% YTD, falling short of the 4.1% average from H2 2020. The January short squeeze and potential for hedge fund deleveraging seemed like it could trigger greater usage of the equity finance channel, as was the case in the Q1 2020 market decline when utilization made a sharp counter-trend increase, however that did not emerge in February.
Stay tuned for monthly revenue snapshots from IHS Markit Securities Finance!
S&P Global provides industry-leading data, software and technology platforms and managed services to tackle some of the most difficult challenges in financial markets. We help our customers better understand complicated markets, reduce risk, operate more efficiently and comply with financial regulation.
This article was published by S&P Global Market Intelligence and not by S&P Global Ratings, which is a separately managed division of S&P Global.
{"items" : [
{"name":"share","enabled":true,"desc":"<strong>Share</strong>","mobdesc":"Share","options":[ {"name":"facebook","url":"https://www.facebook.com/sharer.php?u=http%3a%2f%2fstage.www.spglobal.com%2fmarketintelligence%2fen%2fmi%2fresearch-analysis%2fsecurities-finance-february-2021.html","enabled":true},{"name":"twitter","url":"https://twitter.com/intent/tweet?url=http%3a%2f%2fstage.www.spglobal.com%2fmarketintelligence%2fen%2fmi%2fresearch-analysis%2fsecurities-finance-february-2021.html&text=Securities+Finance+February+2021+%7c+S%26P+Global+","enabled":true},{"name":"linkedin","url":"https://www.linkedin.com/sharing/share-offsite/?url=http%3a%2f%2fstage.www.spglobal.com%2fmarketintelligence%2fen%2fmi%2fresearch-analysis%2fsecurities-finance-february-2021.html","enabled":true},{"name":"email","url":"?subject=Securities Finance February 2021 | S&P Global &body=http%3a%2f%2fstage.www.spglobal.com%2fmarketintelligence%2fen%2fmi%2fresearch-analysis%2fsecurities-finance-february-2021.html","enabled":true},{"name":"whatsapp","url":"https://api.whatsapp.com/send?text=Securities+Finance+February+2021+%7c+S%26P+Global+ http%3a%2f%2fstage.www.spglobal.com%2fmarketintelligence%2fen%2fmi%2fresearch-analysis%2fsecurities-finance-february-2021.html","enabled":true}]}, {"name":"rtt","enabled":true,"mobdesc":"Top"}
]}


