Customer Logins
Obtain the data you need to make the most informed decisions by accessing our extensive portfolio of information, analytics, and expertise. Sign in to the product or service center of your choice.
Customer Logins

EQUITIES COMMENTARY
Mar 08, 2022
Securities Finance February 2022 Snapshot

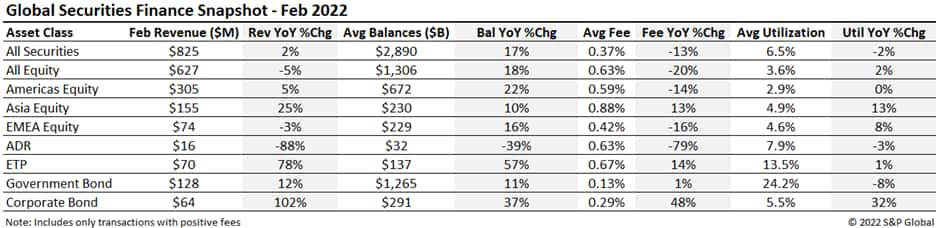
$825m in February securities finance revenue
- February revenues climbed by 2% YoY
- ADR borrow demand declined
- Corporate bond borrow demand remains elevated
- America's equity revenues saw a respite from the continued slump
Global securities finance revenues totaled $825m in February, a 2% YoY rise. The YoY increase was primarily the result of increasing balances, with most major categories showing YoY growth apart from EMEA & ADRs. February did see a resurgence in American equity spreads primarily driven by YoY growth in balances even though the utilization remained flat. For the second consecutive month, ADRs saw a YoY decline in revenues, loan balances and fees in February. In this note, we will discuss the drivers of February revenue.
APAC Equity
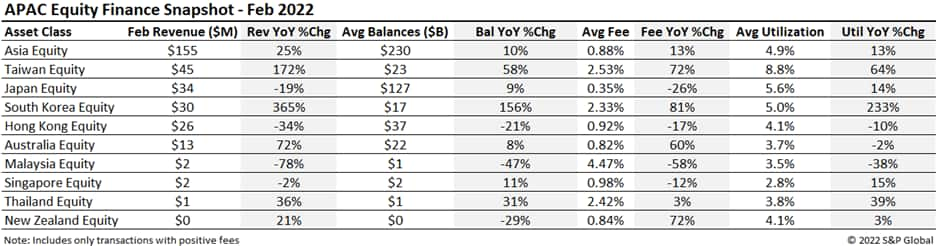
APAC Equity Finance revenues totaled $155m in February, up 25% YoY. Taiwan and South Korea continued their bumper growth compared to the same period last year, producing $45m (+172%) and $30m (+365%) in February. However, compared to the prior month Taiwan declined 8% and South Korea dropped 14%. Japan generated $34m in February and moved back above South Korea. Average loan balances in Japan increased to reach $127bn and utilization in APAC's largest equity market was 5.6%, up 14% YoY.
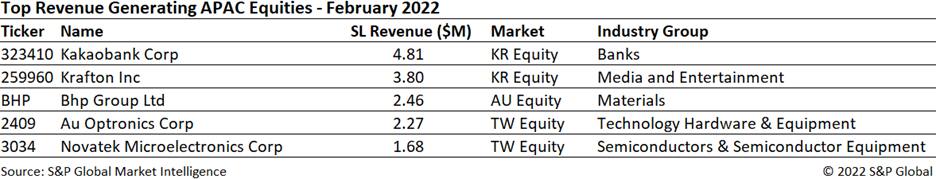
Kakaobank Corp retained the top spot for the 3rd month in a row with $4.81m of revenue in February. Following its delisting from the London Stock Exchange at the end of January there was still revenue generated from BHP Group that helped boost overall revenues in Australia. The other top revenue names were in Taiwan with technology and semiconductor firms Au Optronics and Novatek Microelectronics generating $2.27 and $1.68m, respectively.
Americas Equity
Americas Equity Finance generated $305m in February, a slight uptick of 5% YoY. The decrease in average fees of -14% YoY was buoyed by an increase of average balances of 22% YoY. America's revenues are still off the highs of last year but have reversed the downward trend that started last November.
US and Canadian Equities revenue followed the same pattern with increases of 5% and 2% YoY respectively, driven by increases in average balances (21% & 33% YoY) and decreases in average fees (-14% & -25% YoY).
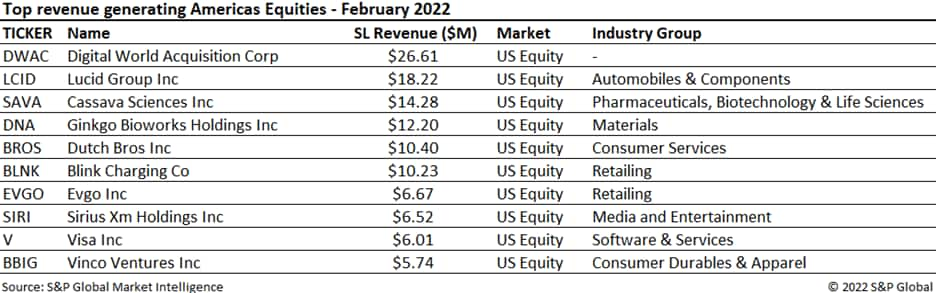
Digital World Acquisition Corp (DWAC) and Lucid Group (LCID) retained the top two spots on the chart in February but swapped positions earning $26.1m and $18.22m respectively. Dutch Bros Inc (BROS) hits the chart for the first time since its traditional IPO back in September 2021. Average fees have increased over 400% MoM to generate $10.4m in February in anticipation of the lock-up expiry date in mid-March. Another gainer on the chart was Cassava Sciences (SAVA) which generated $14.2m off continued pressure on allegations of data manipulation although the FDA recently rejected a petition to halt trials of their Alzheimer's drug. Interest in former SPAC name Ginkgo Bioworks (DNA) continues to increase with a jump in borrow costs of 438% MoM to generate $12.1m for February.
European Equity
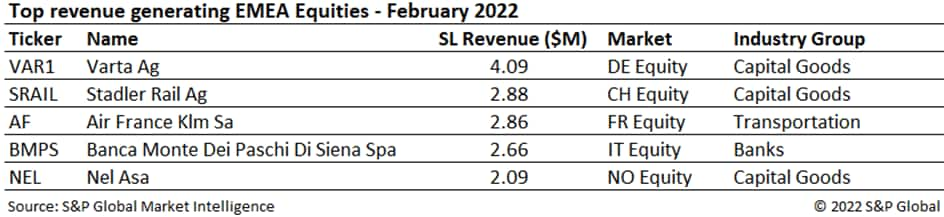
The slow start to the year continues with European equity revenues lagging at $74m, down 3% YoY and down 7.5% from the previous month. Average loan balances are up 16% YoY to $229bn but, aside from Switzerland and Spain, average fees of 0.42% declined 16% highlighting the impact of fee compression on revenue opportunities in the region. The UK continues its slide to the 4th spot with revenues of $8m, down 19% YoY. Switzerland climbed to the 3rd most revenue generating country with $9m in February, a 30% increase YoY. Germany was on top with $14m of equity finance revenue due to strong utilization of 6.5%, up 27% YoY. Norway continues to demand the highest fees in Europe, delivering $6m in February with Nel Asa (NEL NO) contributing 33% of the total revenue.
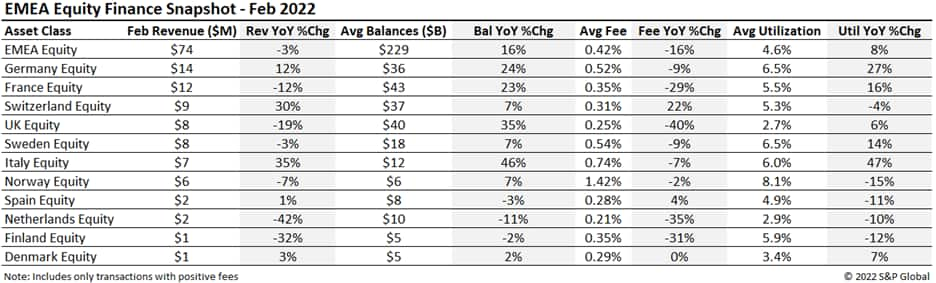
Varta (VAR1) is still the top revenue generating stock in Europe with $4.09m in February. Borrow demand for green energy stocks has launched Nel Asa into the top 5 delivering $2.09m of revenue.
Depository Receipts
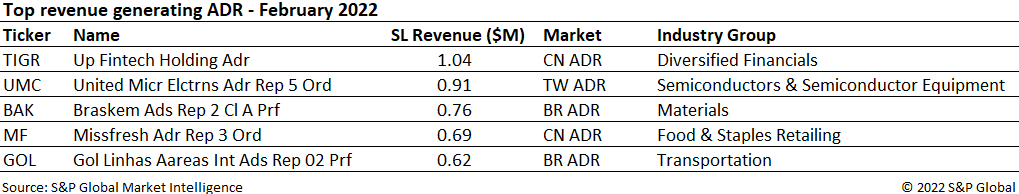
Revenues from lending American Depository Receipts (ADRs) saw a steep drop of 88% YoY and 24% MoM, totaling $16m in February, marking it as the lowest monthly revenue since October 2020. ADR securities finance revenues were led by Up Fintech Holding (TIGR) and United Microelectronics (UMC), a Chinese brokerage firm and a Taiwanese semiconductor firm respectively. TIGR contributed 7% of the ADR finance revenues with $1.04m for the month of February off the cut in prime lending rates by Chinese government benefitting tech stocks in that region. Loan balances for ADR's decreased by 39% YoY, combined with narrower fee spreads (a 79% YoY fall), contributed to the downswing in February revenue.
Exchange Traded Products
Global ETP in the securities lending market continue their stellar performance, reaching an all-time-high revenue of $70m in February, a 78% YoY increase. While numbers in January 2022 seemed to slow down the uptrend noticed in H2 2021, the loan balance increase in February, reaching $136bn, largely contributed to the revenue generated this month. Lendable assets value decreased to $480bn, down from $500bn registered in November 2021, which led to a monthly-average utilization of 13.5%, up by 1% YoY.
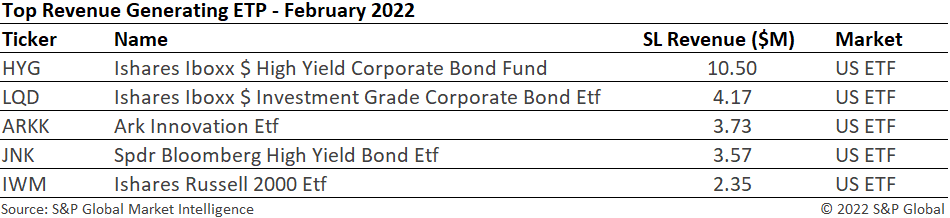
The most revenue generating ETP continues to be the iShares iBoxx $ High Yield Corporate Bond Fund (HYG), which returned $10.5m in February. On the other hand, ARK Innovation Etf (ARKK) maintained its strong performance, delivering $3.73m in revenues, ranking as top equity exchange product earners and 3rd across all ETP.
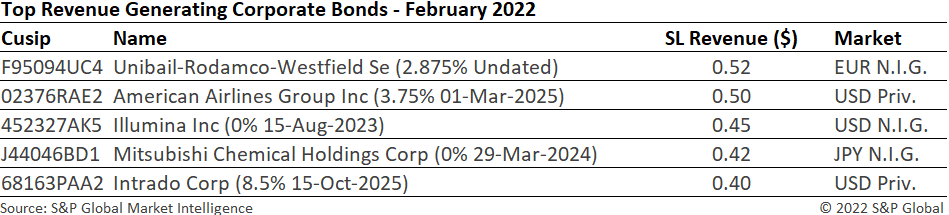
Corporate Bonds
Corporate bond lending revenues came in at $64m for February, a 102% YoY increase. The record level registered this month can be attributed to the spike in both loan balances, up by 37% YoY, and average fee spread increases to 0.29%, up by 48% YoY. The latter suggests a stronger demand for HY bonds, even though levels are still lower than the higher average fees registered at the beginning of 2019. Lendable assets saw a slight decline in February, down 2% YoY. This prompted the utilization to reach an average of 5.5%, up by 32% YoY.
The Unibail-Rodamco-Westfield Se 2.87% perpetual note topped the list of the top revenue names this month, generating $0.52m, down 11% MoM. On the other hand, American Airlines Group Inc 3.75% note due March 2025 was the top earner for US Corporate Bonds, while Mitsubishi Chemical Holdings Corp 0% note due March 2024 was 4th in ranking globally and first for APAC Corporate Bonds.
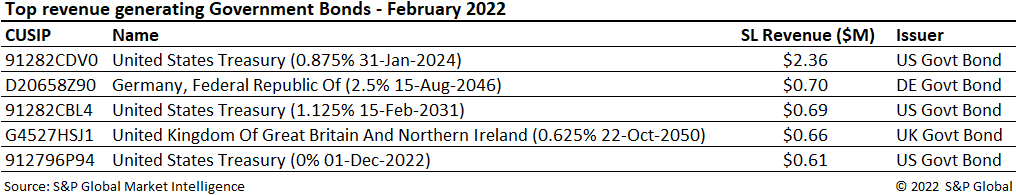
Government Bonds
Fee-spread revenues of global sovereign debt lending totaled $128m for February, a 12% YoY increase. Demand in government bonds increased 11% YoY to $1.26T in positive-fee balances but was slightly down 5% MoM. Average fees held steady at 0.13% for February.
US government bond lending generated $63m, a 7% decrease YoY for positive-fee balances driven by a 7% decline in average fees. European debt lending generated $48.6m, slightly down MoM but up 35% YoY on the back of increases in both average fees (9% YoY) and average balances (24% YoY)
Total government bond lending revenue for agency programs including reinvestment returns and negative fee trades increased 7% YoY as a result of a 7% YoY increase in intrinsic fee income and 7% increase in reinvestment returns YoY. Average balances increased 3% YoY and average borrow costs were up 4%.
Conclusion
Overall revenues increased by 2% in February, as global loan balances continue to trend upward. The usage of exchange traded products in institutional long portfolios and for short hedges has resulted in record highs for lendable assets and loan balances, respectively, with increased borrow demand likely to continue to boost revenues going forward. The impending inflationary curbs led to a trend reversal in the demand for US Treasuries, and similar trends could be observed in the coming months in the EMEA region as well with the inflationary drag exacerbated by the Russia-Ukraine crisis. The ADR revenues declined by 88% YoY, the steepest drop since October 2020, the dip driven by the collective decline in the borrow demand of the top ADR revenue generators. Borrow demand for corporate bonds continued last year's trend, with February monthly revenue seeing a YoY growth of over 102%.
Posted March 8, 2022 by Paul Wilson, Managing Director, Securities Finance
S&P Global Market Intelligence provides industry-leading data, software and technology platforms and managed services to tackle some of the most difficult challenges in financial markets. We help our customers better understand complicated markets, reduce risk, operate more efficiently and comply with financial regulation.
S&P Global provides industry-leading data, software and technology platforms and managed services to tackle some of the most difficult challenges in financial markets. We help our customers better understand complicated markets, reduce risk, operate more efficiently and comply with financial regulation.
This article was published by S&P Global Market Intelligence and not by S&P Global Ratings, which is a separately managed division of S&P Global.
{"items" : [
{"name":"share","enabled":true,"desc":"<strong>Share</strong>","mobdesc":"Share","options":[ {"name":"facebook","url":"https://www.facebook.com/sharer.php?u=http%3a%2f%2fstage.www.spglobal.com%2fmarketintelligence%2fen%2fmi%2fresearch-analysis%2fsecurities-finance-february-2022-snapshot.html","enabled":true},{"name":"twitter","url":"https://twitter.com/intent/tweet?url=http%3a%2f%2fstage.www.spglobal.com%2fmarketintelligence%2fen%2fmi%2fresearch-analysis%2fsecurities-finance-february-2022-snapshot.html&text=Securities+Finance+February+2022+Snapshot+%7c+S%26P+Global+","enabled":true},{"name":"linkedin","url":"https://www.linkedin.com/sharing/share-offsite/?url=http%3a%2f%2fstage.www.spglobal.com%2fmarketintelligence%2fen%2fmi%2fresearch-analysis%2fsecurities-finance-february-2022-snapshot.html","enabled":true},{"name":"email","url":"?subject=Securities Finance February 2022 Snapshot | S&P Global &body=http%3a%2f%2fstage.www.spglobal.com%2fmarketintelligence%2fen%2fmi%2fresearch-analysis%2fsecurities-finance-february-2022-snapshot.html","enabled":true},{"name":"whatsapp","url":"https://api.whatsapp.com/send?text=Securities+Finance+February+2022+Snapshot+%7c+S%26P+Global+ http%3a%2f%2fstage.www.spglobal.com%2fmarketintelligence%2fen%2fmi%2fresearch-analysis%2fsecurities-finance-february-2022-snapshot.html","enabled":true}]}, {"name":"rtt","enabled":true,"mobdesc":"Top"}
]}