Customer Logins
Obtain the data you need to make the most informed decisions by accessing our extensive portfolio of information, analytics, and expertise. Sign in to the product or service center of your choice.
Customer Logins

EQUITIES COMMENTARY
Feb 17, 2022
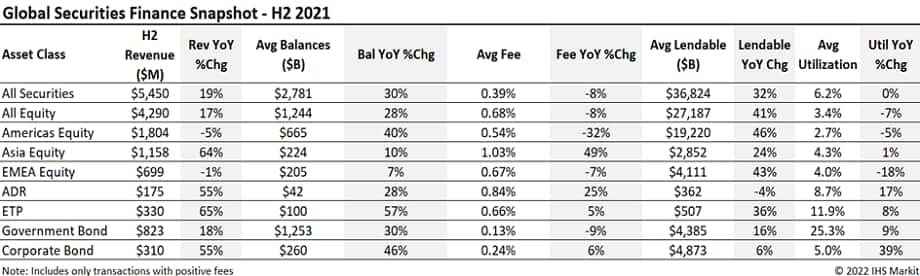
Securities Finance H2 2021 Snapshot

Securities finance revenue $5.45bn in H2 2021, most yearly revenue since 2008
- H2 revenues increase 19% YoY
- ETP balances hit all-time high
- USD Corporate bond revenues lead the ascension
- Americas and EMEA equities specials balances in decline
Global securities finance revenue reached $5.45bn in the second half of 2021, an increase of 19% YoY. While the utilization of lendable assets remained flat compared to H2 2020, the average loan balance increased by more than 30% YoY, the highest observed since the start of the pandemic. Fee spreads continued to decrease globally, with an 8% YoY drop, although Asian equities gained a substantial 49% increase in average fees, partly led by the surge of specials balances in the Taiwan and South Korean equities markets. Americas equities specials balances fell by 21% compared to H1 2021 and even with dividend reinstatement, EMEA equities specials balances dropped by 32% YoY. ETPs, ADRs and Corporate bond markets delivered the best YoY performances, driven by an increase in loan balances.
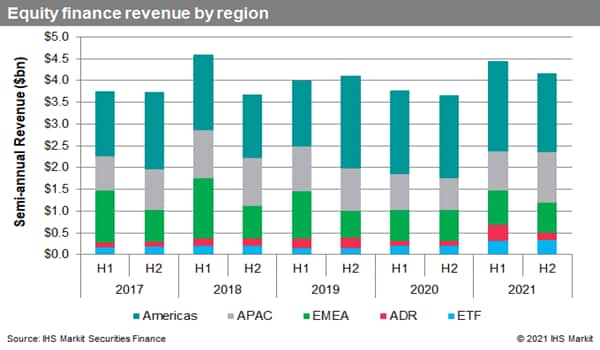
Americas equity finance revenues came in at $1.8bn for H2 2021, a 5% YoY decline. Americas specials balances also fell short compared to H2 2020, partly due to a decrease of fee-spread for Canadian equities, down 33% YoY. Whilst the highlighted interest around US IPOs was less pronounced in comparison to the past two years, Robinhood Markets Inc. (HOOD) was a key performer in H2 2021, with $121m of revenues and ranking among the largest IPO revenue generators in the past two years.
Equity finance revenues in Europe dropped in the second half of 2021, failing to cross the $700bn mark, driven by low equities specials balances in the region. Lendable assets were on the rise, with an increase of 43% YoY. However, the utilization of these assets failed to match the pace and declined by more than 18%. Two key markets in the region, the UK and Germany, declined in revenues, recording -22% and -45% YoY changes respectively. On the other hand, France's equity finance revenues doubled compared to H2 2020, topping $229m in revenues. A significant contributor to France's sharp increase was driven by the Vivendi Se spin-off. In the second half 2021, the event generated $130m in revenues, accounting for 57% of the returns generated in France, and 19% of the European region.
Across equities globally, the APAC region delivered the strongest revenue performance in H2 2021. With a 64% increase YoY with $1.1bn in revenues, Asian equities displayed an outstanding performance, almost doubling EMEA equity revenues. This is attributed to a series of factors, the most notable being the increase in specials balances, which led to a 49% YoY average fee-spread increase. The lift of short sale bans led to a stellar performance in both Taiwan and South Korea equities, while the rest of the region benefitted from new opportunities through IPOs and high demand on the technology sector. Names like Krafton Inc, Lg Display Co Ltd, and Au Optronics Corp were among the top 10 revenue generating names, while the real estate company China Evergrande Group was the top earner in the region, contributing $25.86m in revenue.
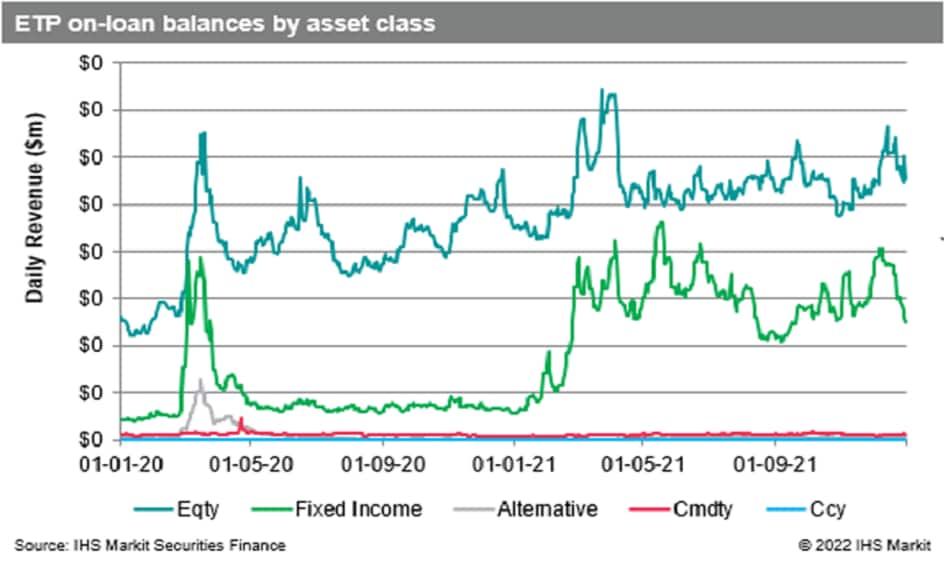
Global ETP lending revenues were $330m for H2, an all-time high record, representing a 65% YoY increase. Revenues performed consistently each month throughout the period, with December being the top revenue generating month, crossing the $60m mark. Return drivers varied, the most significant of which was linked to the increase in loan balances, reaching $100bn for the first time and accounting for a 57% YoY increase. Fixed income ETP lending generated $107m in H2, representing 34% of global ETP returns. Lending of both equity and fixed income ETPs saw surging revenues compared to previous periods, with 9 of the 10 top revenue generating assets being US ETPs. iShares iBoxx $ HY Corporate Bond Fund continued to lead as the top earner, with $48m generated in H2 2021,15% of ETP total returns.
Depository receipts returns saw a surge in H2 2021, reaching $223m in revenue, a 68% YoY increase. ADRs represented 78% of the total Depository Receipts revenues with $175m generated, a 55% YoY increase. The surge in revenues for this period is due to the increase in specials balances, up by 17% YoY. Average fee spreads increased by 25% YoY due primarily to the growing lending revenues in Asian ADRs, up by 88% YoY.
Corporate bond lending revenues continued their upward trend in the second half of 2021, reaching $310m in H2. With a 55% YoY increase, H2 2021 marks the highest lending revenue for corporate bonds since the start of the pandemic. Q4 delivered an exceptional performance, with December revenues reaching $62m, the highest monthly revenue since August 2018. Average lending fees were down by 6% YoY in Q3 and increased by 18% in Q4, while loan balances reached $260bn, the highest since the 2008 financial crisis. USD Corporate bonds drove this ascension, growing by more than 85% YoY, while HY Corporate bonds generated $140m during the second half of 2021.
Fee-based revenue for government bond lending came in at $823m for H2, the largest since H1 2018, and up 18% YoY. Government bond borrow demand remained robust, with $1.25tn in positive-fee global balances for H2, reflecting a 30% YoY increase. Securities finance returns from lending US Treasury securities in H2 2021 represented 55% of the positive fee-spread income in H2 2021. Revenues from lending European sovereigns were $275m, up by 17% YoY and were driven by the highest average balances since 2019. The most revenue generating bond was the UST 10Y due Feb 2031, which led the rankings as the top earning government bond in H2 2021, albeit delivering the same amount of revenue as in March 2021.
Conclusion:
H2 2021 global revenues mark a new post-pandemic record for many asset classes which in previous years had displayed a downward trend. Emerging markets were a key driver for APAC revenues, while European and US markets benefitted from trade deals, spin-offs, and a surge of SPACs, leading to a higher performance globally. Global specials balances fell short YoY, due to a lower demand in the US and Europe, but the surge of ADRs and APAC specials reduced the overall downtrend. The stellar performance of exchange traded products and corporate bonds delivered considerable returns, with more diversification in top earning assets compared to previous years. The year ended on a high note for corporate bonds, with December generating the most revenue for any month in 2021.
S&P Global provides industry-leading data, software and technology platforms and managed services to tackle some of the most difficult challenges in financial markets. We help our customers better understand complicated markets, reduce risk, operate more efficiently and comply with financial regulation.
This article was published by S&P Global Market Intelligence and not by S&P Global Ratings, which is a separately managed division of S&P Global.
{"items" : [
{"name":"share","enabled":true,"desc":"<strong>Share</strong>","mobdesc":"Share","options":[ {"name":"facebook","url":"https://www.facebook.com/sharer.php?u=http%3a%2f%2fstage.www.spglobal.com%2fmarketintelligence%2fen%2fmi%2fresearch-analysis%2fsecurities-finance-h2-2021-snapshot.html","enabled":true},{"name":"twitter","url":"https://twitter.com/intent/tweet?url=http%3a%2f%2fstage.www.spglobal.com%2fmarketintelligence%2fen%2fmi%2fresearch-analysis%2fsecurities-finance-h2-2021-snapshot.html&text=Securities+Finance+H2+2021+Snapshot+%7c+S%26P+Global+","enabled":true},{"name":"linkedin","url":"https://www.linkedin.com/sharing/share-offsite/?url=http%3a%2f%2fstage.www.spglobal.com%2fmarketintelligence%2fen%2fmi%2fresearch-analysis%2fsecurities-finance-h2-2021-snapshot.html","enabled":true},{"name":"email","url":"?subject=Securities Finance H2 2021 Snapshot | S&P Global &body=http%3a%2f%2fstage.www.spglobal.com%2fmarketintelligence%2fen%2fmi%2fresearch-analysis%2fsecurities-finance-h2-2021-snapshot.html","enabled":true},{"name":"whatsapp","url":"https://api.whatsapp.com/send?text=Securities+Finance+H2+2021+Snapshot+%7c+S%26P+Global+ http%3a%2f%2fstage.www.spglobal.com%2fmarketintelligence%2fen%2fmi%2fresearch-analysis%2fsecurities-finance-h2-2021-snapshot.html","enabled":true}]}, {"name":"rtt","enabled":true,"mobdesc":"Top"}
]}