Customer Logins
Obtain the data you need to make the most informed decisions by accessing our extensive portfolio of information, analytics, and expertise. Sign in to the product or service center of your choice.
Customer Logins

EQUITIES COMMENTARY
Feb 11, 2022
Securities Finance January 2022 Snapshot

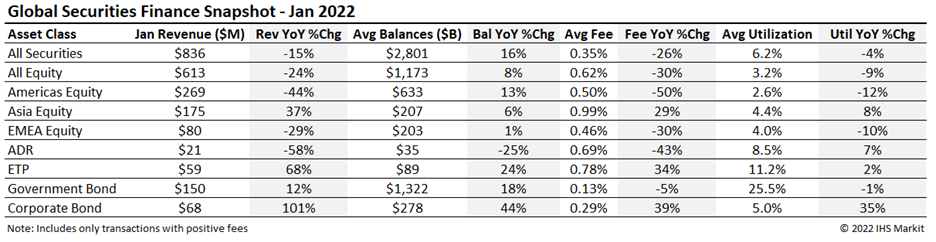
$836m in January securities finance revenue
- January revenues dropped by 15% YoY
- ADR borrow demand declined
- Taiwan and South Korea lead APAC upswing
- Continuation of the slump in EMEA & American equity revenue
Global securities finance revenues totaled $836m in January, a 15% YoY decline. January saw the lowest global equity revenue since February 2021 which can be attributed to narrower EMEA and Americas equity spreads. The general rise in borrow demand seen last year for ETPs, Corporate Bonds and ADRs took a turn for the worse for ADRs, as revenues fell by 58% YoY. In this note we will discuss the drivers of January revenue.
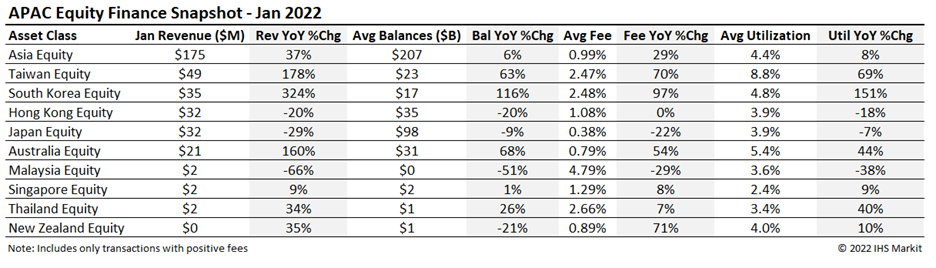
APAC Equity
APAC Equity Finance revenues totaled $175m in January, a 37% YoY increase but a step down of 13% MoM. The region continues to boast the highest average fees globally at 0.99%, a 29% increase YoY and balances remained steady at $207b. Taiwan and South Korea both continue to lead the region in revenue, producing $49m (+178% YoY) and $35m (+324% YoY) respectively. Australia produced $21m in January, a 160% YoY increase and 47% MoM increase.
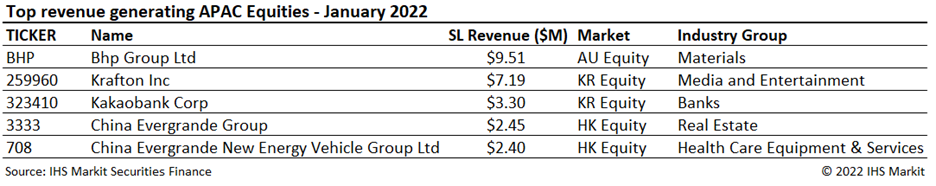
Kakaobank Corp (323410) took the third spot on the top five for the second month in a row and video game developer Krafton Inc (259960) dropped one spot from last month. The top spot was taken over by BHP Group which announced they would delist from the London Stock Exchange effective January 31st. The delisting led to the UK shares trading under the ASX listing as UK holders sold their positions, creating an arbitrage opportunity between the two.
Americas Equity
Americas Equity Finance revenues totaled $269m for January, a decline of 44% YoY but a slight increase of 5% MoM. Average fees ticked up 12% MoM but still trailed last year's numbers by 50%. Even though specials balances saw a decrease in January overall average balances had an increase of 13% YoY.
US Equities contributed $244m in revenue in January, a decline of 46% YoY, when the markets were moved by new SPAC deals and the retail short squeeze phenomenon. In step with the Americas, US Equities saw a decrease in average fees (-52% YoY) and an increase in average balances (12% YoY).
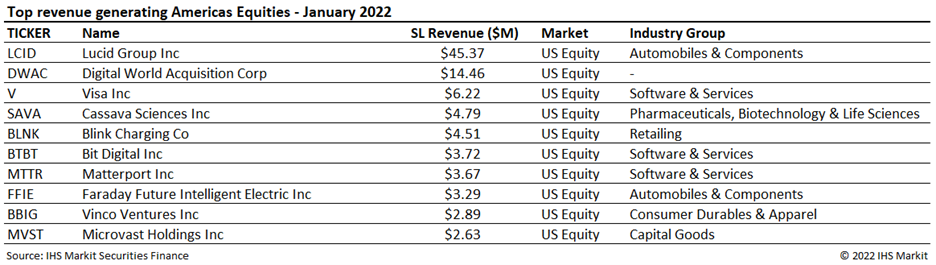
The top two revenue generating names in US Equites came from two different stories from the SPAC life cycle. Lucid Group Inc (LCID) generated $45.37m from an increase of 799% in average fees and 28% in average balances headed into their post-merger lockup expiry. Digital World Acquisition Corp (DWAC) continued its rise in the monthly rankings with $14.46m in revenue due to increases in average fees of 124% and average balances of 29%. With their business combination scheduled to close sometime in Q1, this will be a name to track.
European Equity
EMEA Equity Finance continued its downtrend in January with revenues of $80m, a 29% YoY decrease. France (-21%), Germany (-60%) and UK (-44%) revenues all declined compared to the same period in 2021 and are not showing any new specials activity as we begin 2022 as we recorded a drop of 30% YoY in average fees. There were some bright spots in the Nordics with Sweden maintaining monthly revenues since December, generating $8m and up 17% YoY. In Norway, borrow demand for sustainable energy stocks has produced some new equity finance opportunities. Norway delivered $4m of revenues in January, up 60% YoY, with Nel Asa contributing 31% of the total and entering the EMEA top 10.
Varta (VAR1) remains at the top of the list, generating $4.27m in January. BMPS continues to bolster equity finance revenues with $3.71m and 40% of the total for Italy.
Depository Receipts
Revenues from lending American Depository Receipts (ADRs) saw a steep drop of 58% YoY and 54% MoM, totaling $21m in January, marking it as the lowest monthly revenue since October 2020. ADR securities finance revenues were led by BHP Group ADR (BHP) and Bit Mining Ltd (BTCM), a Chinese bitcoin mining firm. BHP contributed 12% of the ADR finance revenues with $2.5m for the month of January off the delisting of the company from the London Stock exchange. Loan balances for ADR's decreased by 25% YoY, combined with narrower fee spreads (a 43% YoY fall), contributed to the downswing in January revenue.
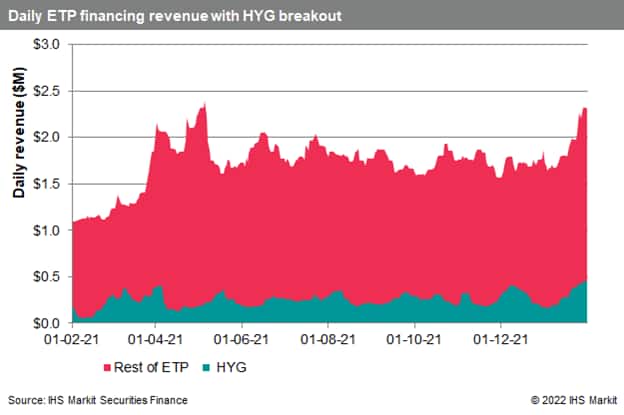
Exchange Traded Products
Global ETP revenues totaled $59m in January 2022, a 68% YoY increase, however there was a 5% decline compared with December. The increase in loan balances, up by 24% YoY, continued to be the main driver of the YoY growth in revenues. The average fee increased to 0.78%, the highest since April 2021, and up by 34% YoY.
The iShares iBoxx $ High Yield Corporate Bond Fund (HYG) maintained its strong performance, delivering $9.3m in revenue and contributing 16% of all ETP revenues. The ARK Innovation etf (ARKK) was the top ranked equity product, ranking 3rd across all ETPs. The latter delivered $3.23m in revenue, primarily driven by an increase in average loan balances, reaching $1bn for the second month in a row.
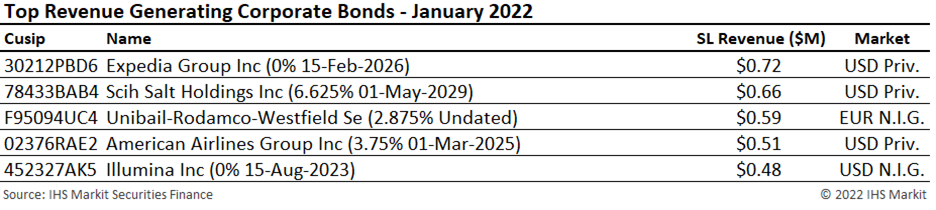
Corporate Bonds
Corporate bond lending revenues came in at $68m for December, a 101% YoY increase and 7% MoM increase. Demand continued to increase, following the 2021 trend with average balances up 44% YoY and 3% when compared to December 2021. The increase in revenue can also be attributed to the uptick in average fees of 39% YoY and average utilization of 35%.
The Expedia Group Inc 0% note due February 2026 sat on top of the charts for a second month in a row up another 15% MoM. Also holding firm in the second spot is the Scih Salt Holdings Inc 6.625%, bringing in $.664m for January, up 23% MoM.
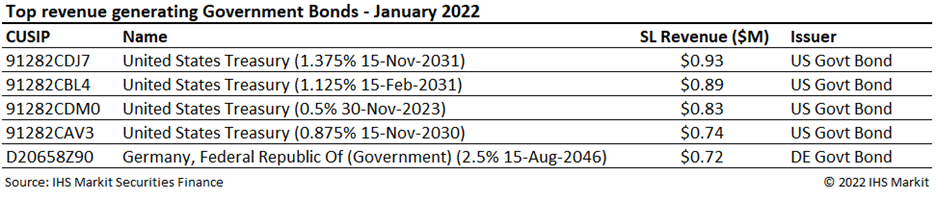
Government Bonds
Fee-spread revenues of global sovereign debt totaled $150m for January, a 12% YoY and a 1% MoM decline. Government bond borrow demand remains robust with $1.32T in positive-fee global balances for January reflecting an 18% YoY increase. US government bond lending revenue came in at $77.8m for January, a 2% YoY and 6% MoM drop and the lowest total since November 2021. The Nov 2031 UST 10Y note (91282CDJ7) took the top rank on the revenue table from the Nov 2023 UST 2Y (91282CDM0), followed closely by the Feb 2031 UST 10Y (91282CBL4). Lending European sovereign debt yielded a return of $52.6m for January, a 22% YoY and 7% MoM increase.
Total government bond lending revenue for agency programs including reinvestment returns and negative fee trades increased 5% YoY as a result of a 10% YoY increase in intrinsic fee income and 2% increase in reinvestment returns YoY. Average balances increase 6% YoY and average borrow costs were up 8%.
Conclusion
Global securities finance revenues dropped by 15% YoY in January, the drop-off marking it as the lowest monthly revenue since April 2021. Amidst increasing concerns over inflationary curbs and the Federal Reserve timeline announcement to raise interest rates, the increasing borrow demand for US Treasuries took a turn along with rising 10Y yields. A lack of hard to borrow stocks weighed heavily on the narrowing EMEA & Americas equity revenues, which were thrown into further disarray as rising interest rates pressured technology stocks making their rich valuations look less attractive. ADR revenues declined by 58% YoY the steepest drop since October 2020, the dip driven by the collective decline in the borrow demand of the top ADR revenue generators. Borrow demand for corporate bonds continued last year's trend, with January monthly revenue seeing a 101% YoY growth.
S&P Global provides industry-leading data, software and technology platforms and managed services to tackle some of the most difficult challenges in financial markets. We help our customers better understand complicated markets, reduce risk, operate more efficiently and comply with financial regulation.
This article was published by S&P Global Market Intelligence and not by S&P Global Ratings, which is a separately managed division of S&P Global.
{"items" : [
{"name":"share","enabled":true,"desc":"<strong>Share</strong>","mobdesc":"Share","options":[ {"name":"facebook","url":"https://www.facebook.com/sharer.php?u=http%3a%2f%2fstage.www.spglobal.com%2fmarketintelligence%2fen%2fmi%2fresearch-analysis%2fsecurities-finance-january-2022-snapshot.html","enabled":true},{"name":"twitter","url":"https://twitter.com/intent/tweet?url=http%3a%2f%2fstage.www.spglobal.com%2fmarketintelligence%2fen%2fmi%2fresearch-analysis%2fsecurities-finance-january-2022-snapshot.html&text=Securities+Finance+January+2022+Snapshot+%7c+S%26P+Global+","enabled":true},{"name":"linkedin","url":"https://www.linkedin.com/sharing/share-offsite/?url=http%3a%2f%2fstage.www.spglobal.com%2fmarketintelligence%2fen%2fmi%2fresearch-analysis%2fsecurities-finance-january-2022-snapshot.html","enabled":true},{"name":"email","url":"?subject=Securities Finance January 2022 Snapshot | S&P Global &body=http%3a%2f%2fstage.www.spglobal.com%2fmarketintelligence%2fen%2fmi%2fresearch-analysis%2fsecurities-finance-january-2022-snapshot.html","enabled":true},{"name":"whatsapp","url":"https://api.whatsapp.com/send?text=Securities+Finance+January+2022+Snapshot+%7c+S%26P+Global+ http%3a%2f%2fstage.www.spglobal.com%2fmarketintelligence%2fen%2fmi%2fresearch-analysis%2fsecurities-finance-january-2022-snapshot.html","enabled":true}]}, {"name":"rtt","enabled":true,"mobdesc":"Top"}
]}