Customer Logins
Obtain the data you need to make the most informed decisions by accessing our extensive portfolio of information, analytics, and expertise. Sign in to the product or service center of your choice.
Customer Logins

EQUITIES COMMENTARY
Jul 13, 2022
Securities Finance June Snapshot 2022

- Global Securities lending revenues total $1.143 bln
- US dominates equity revenues
- Interest in ETP's remains strong
- Corporate Bonds continue to see strong demand and a further increase in borrowing fees
Global securities finance revenues totaled $1.143 bln in June 2022. Surging demand for corporate bonds (28% increase in utilization YoY, 14% increase in on loan balances YoY and 87% increase in revenues YoY) and strong demand for equities (17% increase in utilization YoY and 9% increase in revenues YoY) were the key contributors to the 13% increase in revenues in comparison with June 2021. Average fees were higher in both bonds and equities as on loan balances increased YoY by 5%. Revenues in ADR's continued to fall however (down 12% YoY), together with on loan balances (down 47% YoY) and utilization (down 11% YoY).

Americas
Revenues across the Americas saw a 15% increase YoY and a 32% increase when compared MoM. Average fees in the region increased by 15% MoM as the market was dominated by high demand, high fee stocks (specials). The top ten revenue generating stocks in this market contributed to over 40% of all revenues generated in this region. Many of these names remained unchanged from May. Gamestop (GME US) reemerged however as the strongest single name revenue generator for the month. Over this period its share price declined towards month end and demand to borrow strengthened as a result. Despite seeing an increase in revenues, Lucid group was subsequently knocked into second place. Average utilization across the region remained unchanged MoM.
APAC Equity
Compared with June 2021, APAC equities witnessed a fall in revenues (down 5% YoY), on loan balances (down 4% YoY) and average fees (down 1% YoY) despite average utilization having increased by 23% YoY. The region fared slightly better when compared MoM however with average on loan balances increasing 3% (MoM), revenues remaining flat ($165m) and average fees increasing very slightly. The added complexity involved in engaging in securities lending in Taiwan made it the standout market in the APAC region having generated $48m in revenues (28% increase in revenues YoY and 29% of all APAC revenues) with an increase in average fees (21% YoY, 5.2% MoM). In Japan, the largest lending market in the region, both average fees (+13%) and on loan balances (+5%) increased when compared with May 2022.

Europe
Seasonal activity continued to unwind during the month of June in European markets, therefore on loan balances and average fees continued their downward trajectory. Despite the decrease in activity, securities finance metrics remained healthy in comparison with June 2021 with both utilization and average balances significantly higher. Revenues across the region were only 2% lower compared to June 2021 but fell 52% in comparison to the previous month. This decline is reflected in the average fee (0.54%) which decreased 16% compared to June 2021 and 47% compared to May 2022. Sweden and Finland saw strong increases in revenues compared to June 2021 up 105% and 59% respectively. On loan balances, average fees and utilization were all higher than at the same point last year for these markets.

ADR
Demand for ADR's continued to decline over the month in comparison to the same period in 2021 but remained unchanged in comparison with May 2022. Despite relatively high utilization in this sector (8.9%), on loan balances were 47% lower YoY. Average fees were 69% (YoY) higher however which depicts a sector with a high concentration of borrowing activity in a handful of stocks. UMC remained the top earning stock in this sector with little change seen in the Top five borrows.
ETP
Exchange Traded Products continued to fare well over the month of June. Demand to borrow remained strong (13% increase in balances YoY) as average fees increased by 23% YoY. In comparison with May 2022, average balances were down 3% to $112 bln which translated into a slight decrease in average utilization of 0.2% (MoM).
US corporate bond-based ETF's continued to dominate the top revenue generators in this sector. Revenues generated by HYG, which continued to top the table, increased by $1.65m over the month. SPY and IWM made an appearance in the top five as demand to borrow assets tracking more volatile equity markets increased.

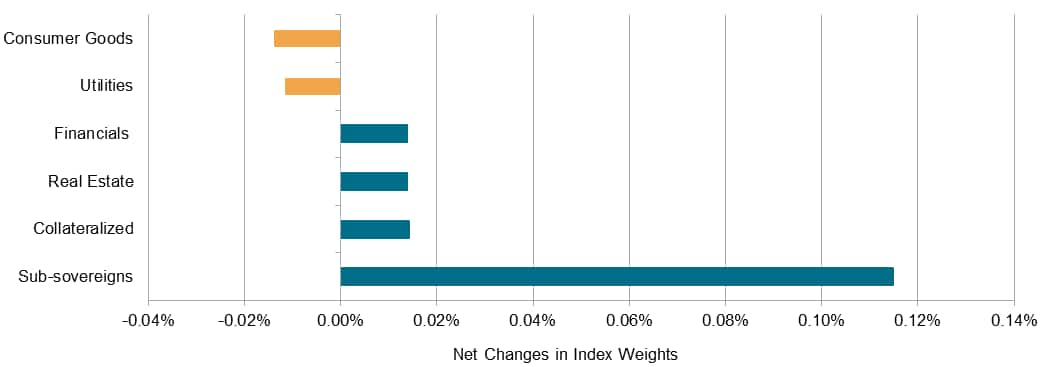
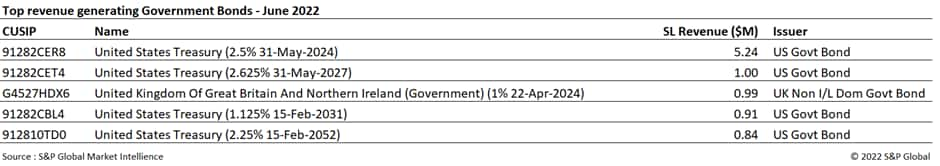
Government Bonds
As stock markets continued a downward trend over the month of June, the demand for high quality, liquid collateral increased. Government bond securities finance revenues increased circa 6% in June (MoM). Average balances, average fees and utilization all increased as well. European Government bonds saw a 21% increase in revenues (MoM) generating $54.4m. The increase in the FED benchmark rate had an impact on Treasury flows as bond yields increased. US treasuries unsurprisingly, therefore continued to dominate the specials list. Over the period, US Treasuries generated $93.2m in securities lending revenues, a 12% increase on May 2022.
Corporate Bonds
Corporate bonds continued to see strong demand over the month of June with an 87% increase in revenues, 14% increase in on loan balances, 64% increase in average fees and a 28% increase in average utilization in comparison to June 2021. Despite average balances falling slightly in comparison to May (decrease of circa 4%) average fees increased. Corporate bond demand in Europe continues to be supported by the impact of the CSPP (Corporate Sector Purchase Program). As bond purchases are being wound down by European central banks, yields have been increasing as the market no longer has any guaranteed buyers. As this bond buying activity is phased out, the European corporate bond market is expected to continue to experience sustained borrowing demand. Despite the focus on Europe, the top five specials in the month of June were US listed assets. The limited distribution offered by private placement bonds puts this category at the top of the revenue earning table for corporate bonds. The revenues generated by the top five borrows only contributed 3% of the overall revenues generated by the corporate bond sector in June however which illustrates the broad extent of the borrowing demand in this asset class.

Conclusion
Securities finance markets remained robust throughout the month of June with an increase in revenues, average fees, on loan balances and utilization (YoY). In the equity space the Americas dominated, accounting for 44% of all monthly securities finance revenues alone ($502 bln). The increase in average fees coupled with stationary utilization rates suggests an increase in demand and increasing fees for those names that were on loan throughout the month. In Europe, seasonal activity continued to unwind which translated into a decrease in average fees and on loan balances. In Asia, outside of Taiwan, all markets were relatively stable MoM in terms of borrow demand.
ADR's continued to see a fall in demand as seen in previous months. Demand remained robust YoY for ETP's where equity index tracking products entered the top five borrow list alongside the stalwart corporate bond trackers.
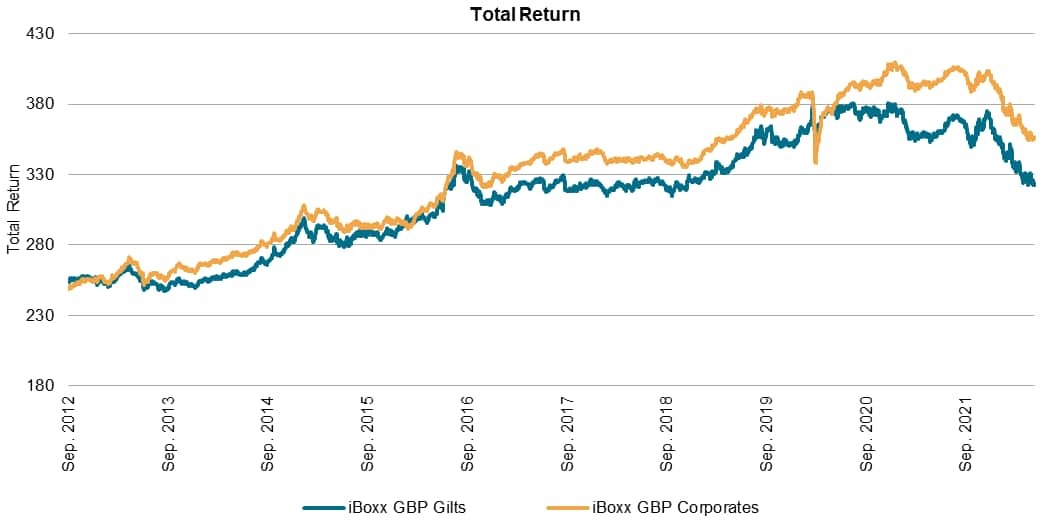
In fixed income markets, corporate bonds continued their impressive run. Revenues continued to increase with remarkable growth in comparison with June 2021. Government bond borrowing also saw upticks in terms of revenues and average balances both MoM and YoY.
S&P Global provides industry-leading data, software and technology platforms and managed services to tackle some of the most difficult challenges in financial markets. We help our customers better understand complicated markets, reduce risk, operate more efficiently and comply with financial regulation.
This article was published by S&P Global Market Intelligence and not by S&P Global Ratings, which is a separately managed division of S&P Global.
{"items" : [
{"name":"share","enabled":true,"desc":"<strong>Share</strong>","mobdesc":"Share","options":[ {"name":"facebook","url":"https://www.facebook.com/sharer.php?u=http%3a%2f%2fstage.www.spglobal.com%2fmarketintelligence%2fen%2fmi%2fresearch-analysis%2fsecurities-finance-june-snapshot-2022.html","enabled":true},{"name":"twitter","url":"https://twitter.com/intent/tweet?url=http%3a%2f%2fstage.www.spglobal.com%2fmarketintelligence%2fen%2fmi%2fresearch-analysis%2fsecurities-finance-june-snapshot-2022.html&text=Securities+Finance+June+Snapshot+2022+%7c+S%26P+Global+","enabled":true},{"name":"linkedin","url":"https://www.linkedin.com/sharing/share-offsite/?url=http%3a%2f%2fstage.www.spglobal.com%2fmarketintelligence%2fen%2fmi%2fresearch-analysis%2fsecurities-finance-june-snapshot-2022.html","enabled":true},{"name":"email","url":"?subject=Securities Finance June Snapshot 2022 | S&P Global &body=http%3a%2f%2fstage.www.spglobal.com%2fmarketintelligence%2fen%2fmi%2fresearch-analysis%2fsecurities-finance-june-snapshot-2022.html","enabled":true},{"name":"whatsapp","url":"https://api.whatsapp.com/send?text=Securities+Finance+June+Snapshot+2022+%7c+S%26P+Global+ http%3a%2f%2fstage.www.spglobal.com%2fmarketintelligence%2fen%2fmi%2fresearch-analysis%2fsecurities-finance-june-snapshot-2022.html","enabled":true}]}, {"name":"rtt","enabled":true,"mobdesc":"Top"}
]}