Customer Logins
Obtain the data you need to make the most informed decisions by accessing our extensive portfolio of information, analytics, and expertise. Sign in to the product or service center of your choice.
Customer Logins
EQUITIES COMMENTARY
Apr 16, 2021
Securities Finance March 2021
- March revenues increased by 11% YoY
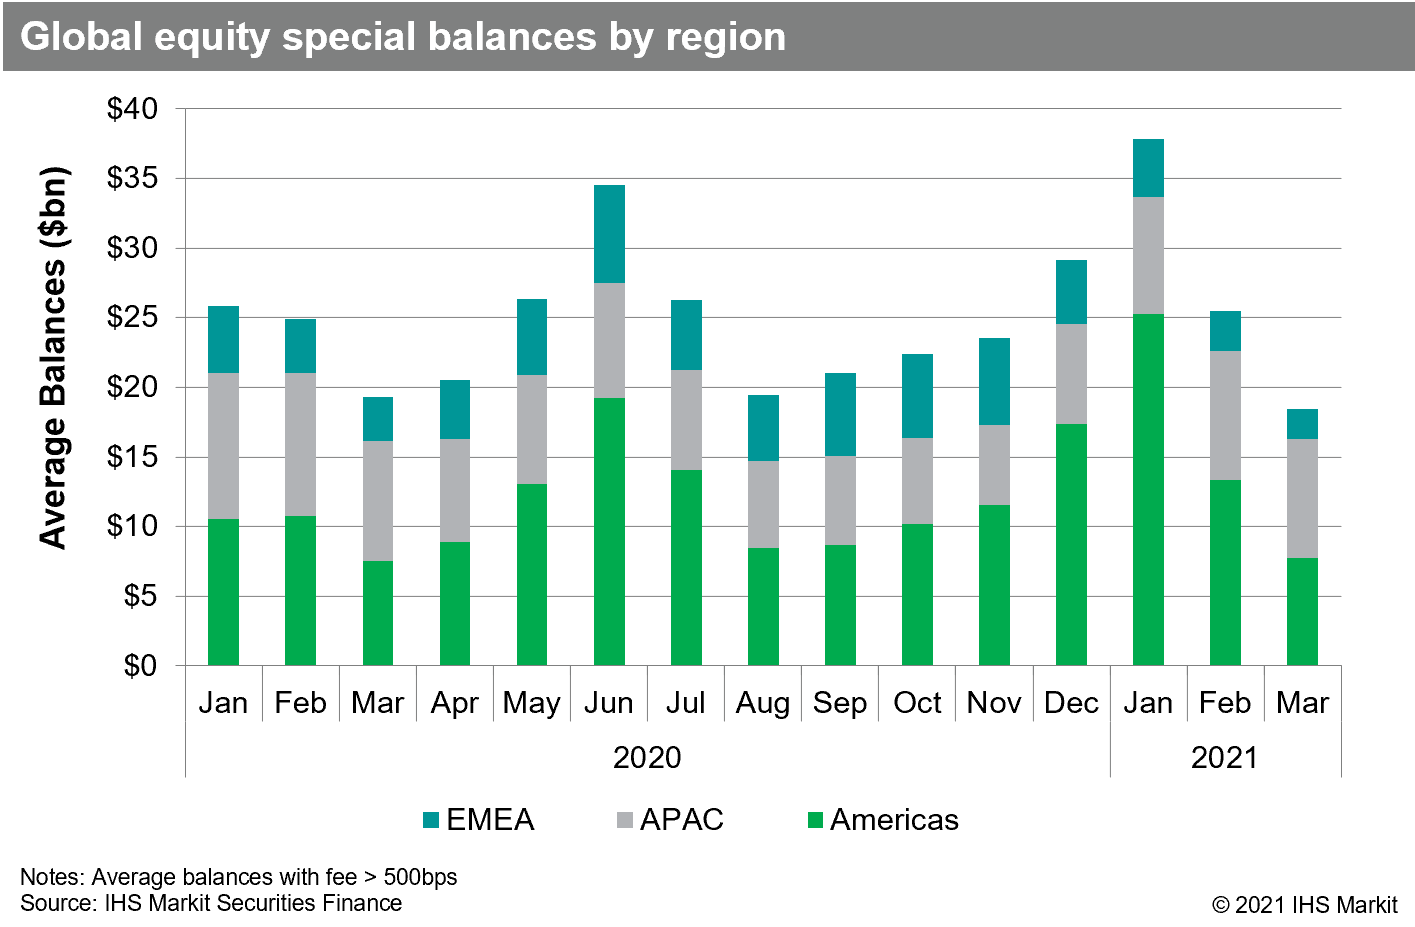
- US equity special balances flatline
- Futu Holdings led ADR revenue surge
- New record for ETP loan balances
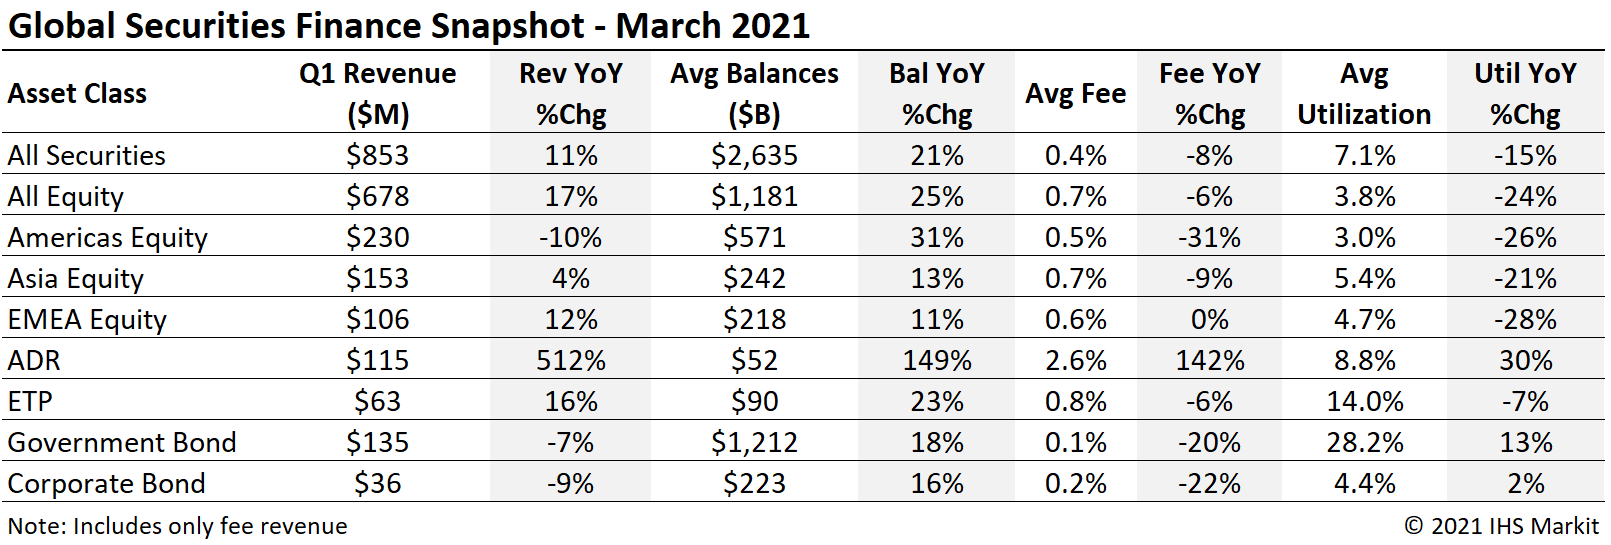
Global securities finance revenues totaled $853m in March, an 11% YoY increase. The YoY increase was primarily the result of ADRs, ETFs and non-US equities. Average daily global revenues decreased 5% MoM compared with February. The primary contributor to the daily revenue shortfall in March was a continued decline in US equity special balances. In this note, we will review revenue drivers from March, which wrapped up the first quarter with $2.6bn in revenue, a 15% YoY increase.

Americas Equity
Americas equity revenues came in at $230m for March, a 10% YoY decline and a 28% decrease in average daily revenue compared with February. The MoM decline was largely the result of declining special balances, reflected in weighted average fees decreasing 31% MoM, while loan balances increased by 4% MoM. Average fees went from being up 32% YoY in January to -31% YoY in March.
US equity revenues came in at $198m for March, a 6% YoY decline. US equity special balances declined by 45% MoM, with an average of $7bn in March, following February's $13bn average, a far cry from January's $25bn average. Special balances are defined in this note as balances with a fee greater than 500bps.

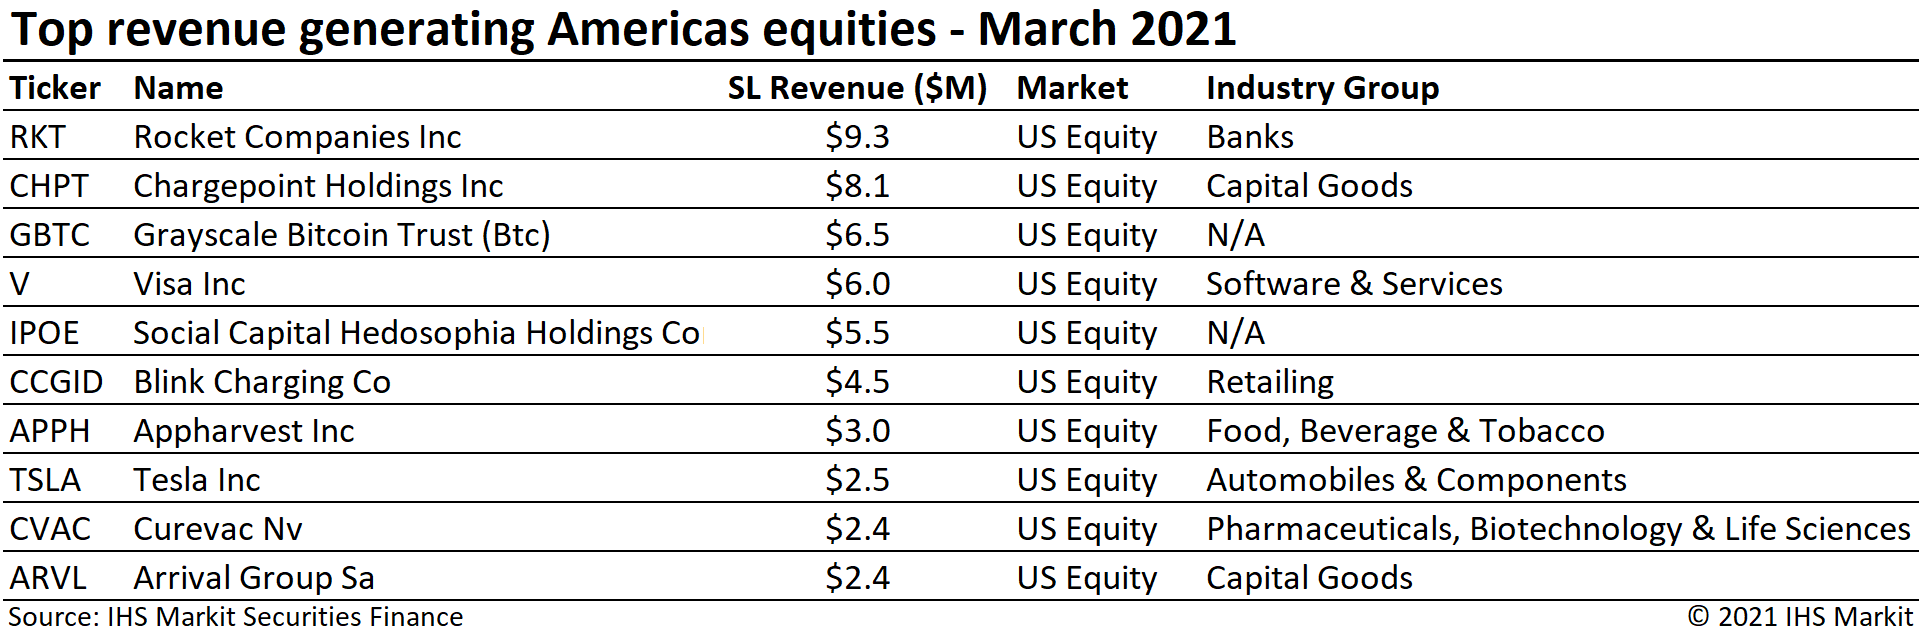
The highest revenue generating US equity was Rocket Companies, whose share price increased dramatically over the last couple days of February and early March, subsequently declining to give back much of the gains. As we have seen with other recent short squeezes, fees for new borrows soared with the increased trading volumes and on-loan values increased initially based on the share price move. Like the share price, borrow demand and average fees declined sharply over the subsequent week, resulting in 98% of March revenue being generated during the first two weeks of the month.

Canadian equity lending revenue of $30.5m reflected a 31% YoY decline. The YoY decline was primarily driven by a 50% decline in average fees, balances increased by 36% YoY. Average daily CA equity revenue increased 22% MoM. Canadian equity specials balances averaged $661m for March, an 8% increase compared with February and the highest monthly average since September 2020.
APAC Equity
APAC equity finance revenues increased by 4% YoY in March, the first YoY change in monthly revenue in more than 12 months. Average daily revenues increased 11.6% compared with February, the fifth consecutive month where daily returns increased MoM. Asia equity special balances continue to have an upward trajectory from the 2020 low point in early November, however March's $8.6bn in daily average special balances reflected a 7% decline compared with February, remaining slightly above the January average.

The largest market, Japan equities, delivered $68m in March revenues, a 7% YoY increase, resulting from increased loan balances. Hong Kong equity finance revenues increased by 39% YoY in March, however average daily returns fell slightly, breaking the streak of five months with increasing daily average revenues set in February. Apart from Malaysian firm Top Glove Corporation, HK equities continue to own the top of the revenue generation leader board. The short sale ban in South Korea continues to limit lending revenue, with $6.5m in February revenue reflecting an 80% YoY decline. South Korea's Financial Services Commission (FSC) has extended its short selling ban until May 2nd, at which point new short sales will be allowed for the benchmark Kospi 200 Index and the small-cap Kosdaq 150.
Depository Receipts
Revenues from lending American Depository Receipts (ADRs) increased 512% YoY. Most of the increase was driven by Hong Kong SAR domiciled Futu Holdings, which generated $81m in March, 71% of the total ADR return, down from 75% in February. Excluding the impact of Futu, March ADR revenues increased 65% YoY.

Apart from Futu's impact on HK ADR revenues, ADRs for Mainland Chinese firms also contributed to revenue growth in March, with $17.5m in revenue reflecting an 161% YoY increase, however March was particularly soft in 2020; total Q1 CN ADR revenues of $59m reflect a 20% YoY increase. European ADRs delivered $6m in March revenue, a 33% YoY decrease. Depository receipts listed outside the US generated $5.6m in February, an 95% YoY increase.
European Equity
European equity returns increased by 12% YoY for March, with $105m in monthly revenue, resulting from an increase in loan balances. EMEA specials balances declined by 25% MoM, with March special balances of $2.2bn. Former leading hard-to-borrow EMEA equity Varta Ag saw borrow demand rebound in March and fees increase slightly, remaining well below levels prior to the January short squeeze.

Exchange Traded Products
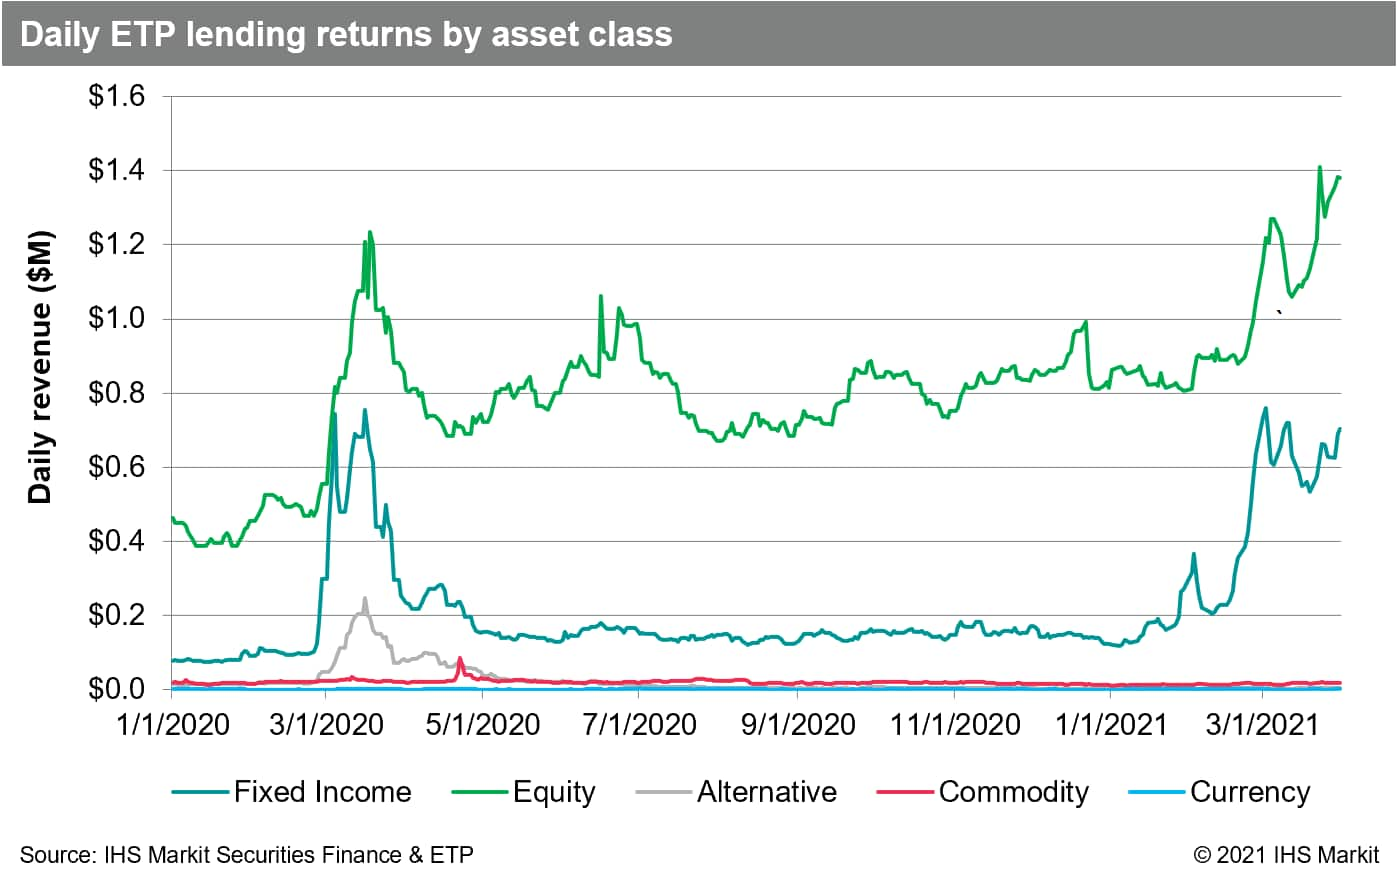
Global ETP revenues totaled $62m for March, a 16% increase compared with March 2020. Average ETP loan balances increased by 23% YoY. Loan balances reached a new all-time high on March 23rd, taking the mantle from the prior record set in February. Revenues for fixed income products more than doubled MoM, with $19.5m in March revenue contributing 34% of the ETP total. Average daily equity ETP revenues increased 42% MoM.


Corporate Bonds
Corporate bond lending returns came in at $36.3m for March, a 9% decline YoY. The long-run decline in corporate bond lending revenues, starting at the post-GFC peak return in late-2018, continues to show signs of reversing course. Average daily revenues in March increased 3.7% MoM. Average monthly loan balances extended the climb from the 2020 low-point in September, $172bn, with March average positive-fee balances of $222bn.

Government Bonds
Government bond borrow demand remains robust, with $1.2T in positive-fee global balances for March reflecting an 18% YoY increase. Revenues totaled $135m for March, a 7% YoY decline compared with March 2020, the peak in sovereign debt fee spread revenues last year. US government bond lending revenue came in at $83m for March, an 10% YoY decrease. The most revenue generating bond was the UST 10Y due Feb 2031, whose stellar $6.5m return in March, resulting from elevated fees during the first two weeks of the month. Returns from lending European sovereigns were $40m for March, a 0.6% YoY decline.

Conclusion
Revenues for Q1 came in at $2.6bn, a 15% YoY increase. The January blowout in crowded US equity short positions led to a decline in special loan balances during the rest of Q1. While the boom in SPAC issuance has slowed, the impacts for equity finance may still be in an early phase, given how many business combinations are possible over the remainder of 2021. Even if only a small number of the several hundred outstanding SPACs find deals in 2021, the revenue potential when an arbitrage opportunity opens between the warrants and common shares can be massive. Even asset classes which failed to generate YoY revenue growth have cause for optimism, including the resumption of dividends and conclusion of short sale bans for equities. For fixed income, US Treasury demand has been strong, and varying expectations for growth and Fed policy may continue to generate lending opportunities. One year on from the bottom of the COVID-crash, YoY comparisons are favorable regarding loan balances, and a number of catalysts are set to support revenue growth. Directional short selling in hard-to-borrow names may be supported by relative underperformance in February and March, however the long shadow of January remains.
Stay tuned for monthly revenue snapshots from IHS Markit Securities Finance!
S&P Global provides industry-leading data, software and technology platforms and managed services to tackle some of the most difficult challenges in financial markets. We help our customers better understand complicated markets, reduce risk, operate more efficiently and comply with financial regulation.
This article was published by S&P Global Market Intelligence and not by S&P Global Ratings, which is a separately managed division of S&P Global.
{"items" : [
{"name":"share","enabled":true,"desc":"<strong>Share</strong>","mobdesc":"Share","options":[ {"name":"facebook","url":"https://www.facebook.com/sharer.php?u=http%3a%2f%2fstage.www.spglobal.com%2fmarketintelligence%2fen%2fmi%2fresearch-analysis%2fsecurities-finance-march-2021.html","enabled":true},{"name":"twitter","url":"https://twitter.com/intent/tweet?url=http%3a%2f%2fstage.www.spglobal.com%2fmarketintelligence%2fen%2fmi%2fresearch-analysis%2fsecurities-finance-march-2021.html&text=Securities+Finance+March+2021+%7c+S%26P+Global+","enabled":true},{"name":"linkedin","url":"https://www.linkedin.com/sharing/share-offsite/?url=http%3a%2f%2fstage.www.spglobal.com%2fmarketintelligence%2fen%2fmi%2fresearch-analysis%2fsecurities-finance-march-2021.html","enabled":true},{"name":"email","url":"?subject=Securities Finance March 2021 | S&P Global &body=http%3a%2f%2fstage.www.spglobal.com%2fmarketintelligence%2fen%2fmi%2fresearch-analysis%2fsecurities-finance-march-2021.html","enabled":true},{"name":"whatsapp","url":"https://api.whatsapp.com/send?text=Securities+Finance+March+2021+%7c+S%26P+Global+ http%3a%2f%2fstage.www.spglobal.com%2fmarketintelligence%2fen%2fmi%2fresearch-analysis%2fsecurities-finance-march-2021.html","enabled":true}]}, {"name":"rtt","enabled":true,"mobdesc":"Top"}
]}


