Customer Logins
Obtain the data you need to make the most informed decisions by accessing our extensive portfolio of information, analytics, and expertise. Sign in to the product or service center of your choice.
Customer Logins

EQUITIES COMMENTARY
Apr 11, 2022
Securities Finance March 2022 Snapshot

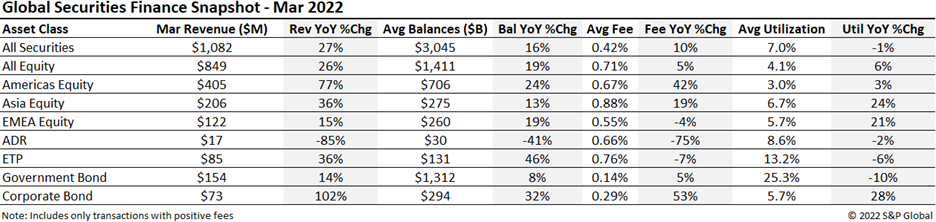
$1.082b in March securities finance revenue
- March revenues climbed by 27% YoY
- Corporate bond borrow demand remains robust
- Continued slump in ADR borrow demand
- Switzerland & Sweden lead EMEA upswing.
Global securities finance revenues totaled $1.08b in March, a 27% YoY rise, with most major categories showing YoY growth apart from ADRs. March saw the highest global equity revenue for this quarter which can be attributed to the recovery in EMEA and Americas equity revenues. For the third consecutive month, ADRs saw a YoY decline in revenues, loan balances and fees in March. In this note, we will discuss the drivers of March revenue.
APAC Equity
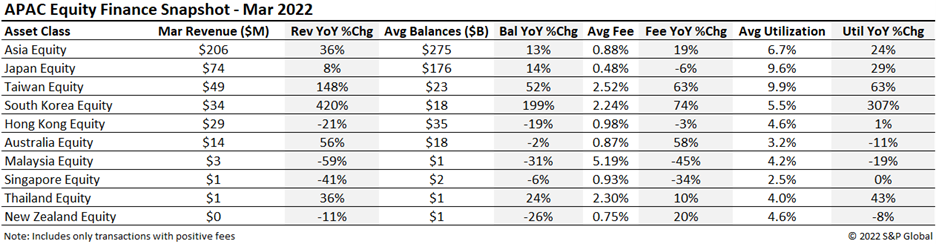
APAC Equity Finance revenues totaled $206m in March, up 36% YoY. Dividend yields in Japan helped generate $74m, up 8% YoY. Revenue opportunities continued in Taiwan and South Korea, producing $49m (+148%) and $34m (+420%) in March. South Korea saw average loan balances grow to $18bn, up almost 200% YoY. Balances and fees were both lower in Hong Kong which saw a 21% drop in equity finance revenue YoY to $29m.
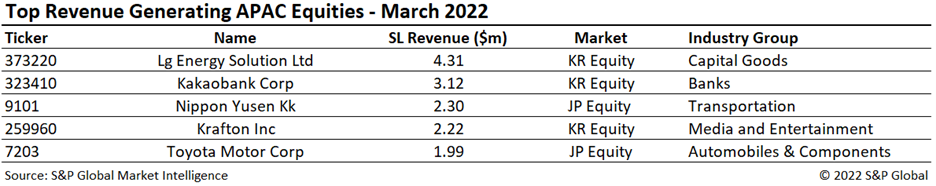
The top revenue name was Lg Energy Solution, generating $4.31m in March. The other stocks in South Korea forming the top 5 were Kakaobank Corp and Krafton, generating $3.12m and $2.22m respectively. Nippon Yusen and Toyota Motor Corp in Japan made up the rest of the top 5.
Americas Equity
Americas Equity Finance revenues totaled $405m in March, up 77% YoY and 31% MoM. An increase in both average fees (+42% YoY) and average balances (+24% YoY) led the way for the upswing. The revenue and average fees seen in March are the highest in the region since June 2021 from recent increased volatility in the markets.
Canadian Equities revenue remained mostly flat YoY producing $29.4m for March with offsetting drivers observed in a +29% YoY increase in balances but a decrease of 23% YoY in average fees. US Equities on the other hand saw increases across the board generating $372.4m, an 86% YoY and 33% MoM increase.
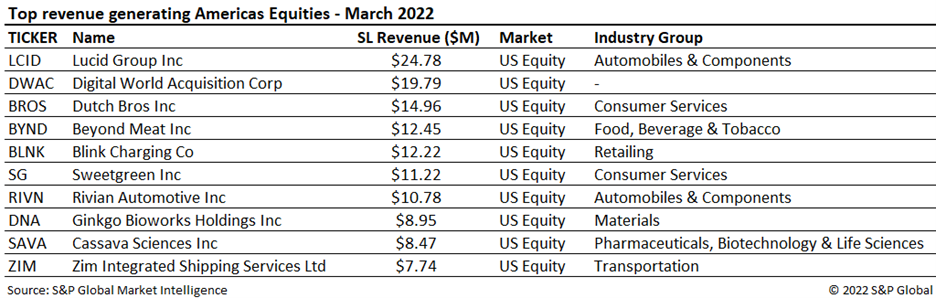
Lucid Group (LCID) and Digital World Acquisition Corp (DWAC) swapped the top two spots for the second month in a row generating $24.7m and $19.7m respectively. Joining the top ten this month is a familiar name in Beyond Meat (BYND) which generated $12.45m in March driven by an increase in borrow fees of 378% from February. Demand remained flat on the name but weaker fourth quarter results and a negative forecast led to multiple price cuts from analysts. Two IPO's join the top ten this month in anticipation of their upcoming lock-up expiry in May - quick service restaurant Sweetgreen (SG) generated $11.22m and EV automaker Rivian Automotive (RIVN) produced $10.78m.
European Equity
The welcome return of spring seasonal income has been a boost to European equity revenues, generating $122m in March, up 15% YoY and 65% from February. Utilization of assets has improved to 5.7%, up 21% compared to March 2021. Switzerland and Sweden produced $26m (+47%) and $24m (+49%) respectively, with France and Germany each generating $16m of revenue in March. Average utilization in Germany reached 9%, with the 3rd highest loan balance in Europe of $43bn.
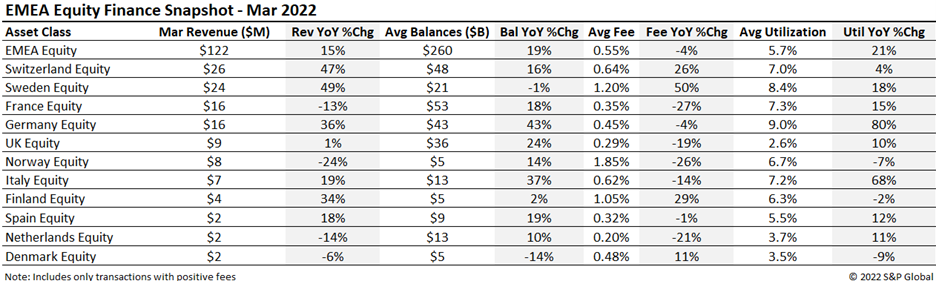
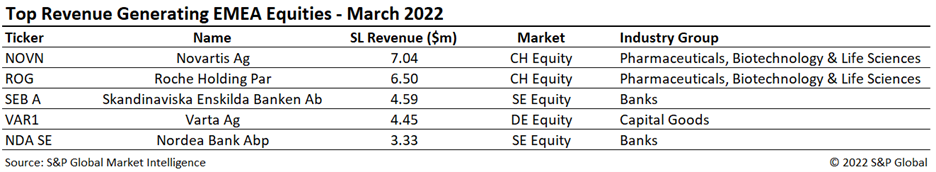
Swiss stocks Novartis and Roche Holding were the top 2 revenue generating stocks in Europe, generating $13.54m between them. Borrow demand remains for German name Varta, keeping this in the top 5 and producing $4.45m of equity finance revenue in March.
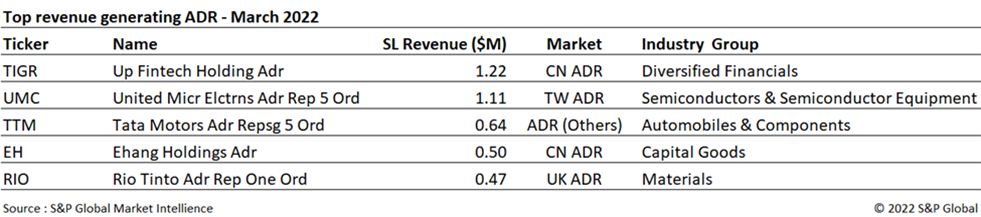
Depository Receipts
Revenues from lending American Depository Receipts (ADRs) continued the downswing with an 85% YoY drop, totaling $17m in March, although it did see a slight up-tick from last month with a 9% MoM rise. ADR securities finance revenues were led by Up Fintech Holding (TIGR) and United Microelectronics (UMC), a Chinese brokerage firm and a Taiwanese semiconductor firm respectively. TIGR contributed 7% of the ADR finance revenues with $1.22m for the month of March. Loan balances for ADR's dropped 41% YoY, combined with narrower fee spreads (a 75% YoY fall), contributed to the downswing in March revenue.
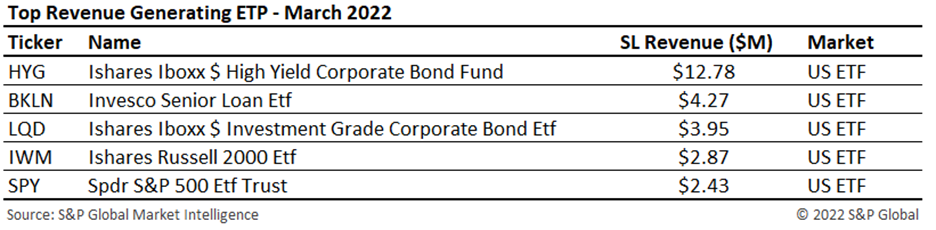
Exchange Traded Products
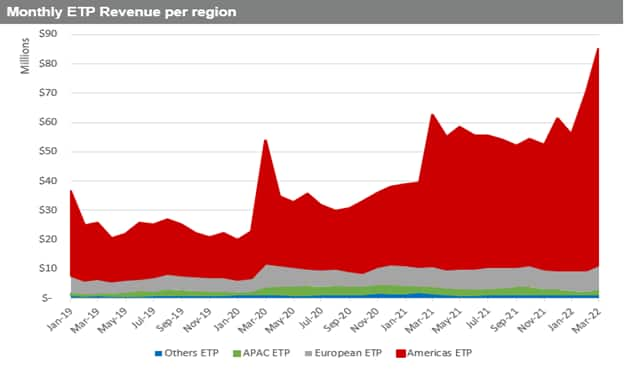
Global ETPs in the securities lending market topped $85m in revenues in March, a 36% YoY increase, marking a new all-time-high. The stellar performance was predominantly driven by an increase in loan balances, reaching $131bn, up by 46% YoY. On the other hand, average fee spread decreased YoY, as well as lendable assets, down from $500bn registered in November 2021, to $461bn in March. This led to a monthly-average utilization of 13.2%, down 6% YoY.
Americas ETPs dominated this month's ranking for the top 5 revenue generating names. iShares iBoxx $ High Yield Corporate Bond Fund (HYG) continued to lead the list, returning $12.78m in March. The second top revenue generating ETP was Invesco Senior Loan Etf (BKLN), with $4.27m, up by 273% MoM.
Corporate Bonds
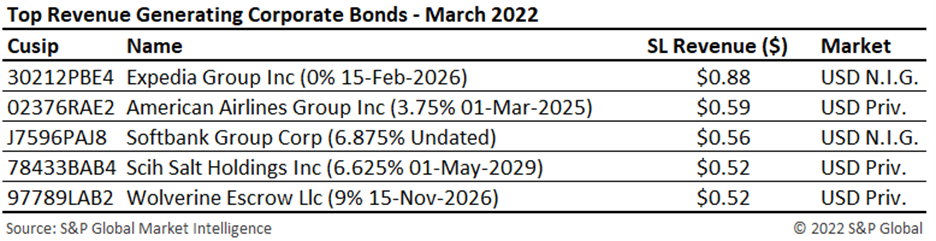
Corporate bond lending revenues came in at $73m for March, a 102% YoY increase. Average loan balances rose to a record $294bn, a 32% YoY increase, while average fee spread increased to 0.29%, suggesting a stronger demand for HY bonds. On the other hand, lendable assets saw a small decline, down to $4.4t, a 3% decrease YoY. This resulted in a spike of the average utilization, up to 5.7%, a 28% YoY increase.
Expedia Group Inc 0% note due Feb 2026 was the top generating name for the month, with a record revenue of $0.88m, up 450% MoM. American Airlines Group Inc 3.75% note due March 2025 maintained its position as the second most generating corporate bond, with $0.59m returned this month.
Government Bonds
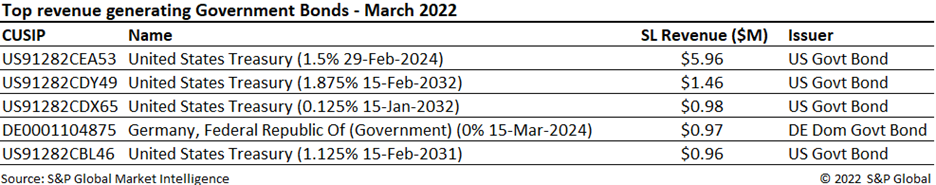
Global sovereign debt fee-spread revenues totaled $154m for February, a 14% YoY and 20% MoM increase topping last December's high mark for revenue. Demand in government bonds increased by 8% YoY which led to $1.31T in positive-fee revenue. Average fees increased by 5% YoY.
US government bond lending generated $77.4m, a 7% decrease YoY for positive-fee balances but a 23% MoM uptick. European debt lending generated $56.8m, up 43% YoY and 17% MoM driven by an increase in both average fees (19% YoY) and average balances (20% YoY).
Total government bond lending revenue for agency programs including reinvestment returns and negative fee trades increased 4% YoY mostly driven by a 6% increase in reinvestment returns YoY. Average balances increased 1% YoY and average borrow costs were flat.
Conclusion
Overall revenues increased by 27% YoY in March, as EMEA revenues recovered some ground after declining during the earlier portion of the quarter. The usage of exchange traded products in institutional long portfolios and for short hedges has resulted in record highs for lendable assets and loan balances, respectively, with increased borrow demand likely to continue to boost revenues going forward. An increasingly cloudy outlook over inflation and its drag further exacerbated by the Russia-Ukraine crisis led to a sustained downswing in the UST borrow demand in addition to the narrowing spreads between short-term & long-term bonds marking the fixed income revenues with uncertainty for the near future. Borrow demand for corporate bonds continued last year's trend, with March monthly revenue seeing a YoY growth of over 102%.
S&P Global provides industry-leading data, software and technology platforms and managed services to tackle some of the most difficult challenges in financial markets. We help our customers better understand complicated markets, reduce risk, operate more efficiently and comply with financial regulation.
This article was published by S&P Global Market Intelligence and not by S&P Global Ratings, which is a separately managed division of S&P Global.
{"items" : [
{"name":"share","enabled":true,"desc":"<strong>Share</strong>","mobdesc":"Share","options":[ {"name":"facebook","url":"https://www.facebook.com/sharer.php?u=http%3a%2f%2fstage.www.spglobal.com%2fmarketintelligence%2fen%2fmi%2fresearch-analysis%2fsecurities-finance-march-2022-snapshot.html","enabled":true},{"name":"twitter","url":"https://twitter.com/intent/tweet?url=http%3a%2f%2fstage.www.spglobal.com%2fmarketintelligence%2fen%2fmi%2fresearch-analysis%2fsecurities-finance-march-2022-snapshot.html&text=Securities+Finance+March+2022+Snapshot+%7c+S%26P+Global+","enabled":true},{"name":"linkedin","url":"https://www.linkedin.com/sharing/share-offsite/?url=http%3a%2f%2fstage.www.spglobal.com%2fmarketintelligence%2fen%2fmi%2fresearch-analysis%2fsecurities-finance-march-2022-snapshot.html","enabled":true},{"name":"email","url":"?subject=Securities Finance March 2022 Snapshot | S&P Global &body=http%3a%2f%2fstage.www.spglobal.com%2fmarketintelligence%2fen%2fmi%2fresearch-analysis%2fsecurities-finance-march-2022-snapshot.html","enabled":true},{"name":"whatsapp","url":"https://api.whatsapp.com/send?text=Securities+Finance+March+2022+Snapshot+%7c+S%26P+Global+ http%3a%2f%2fstage.www.spglobal.com%2fmarketintelligence%2fen%2fmi%2fresearch-analysis%2fsecurities-finance-march-2022-snapshot.html","enabled":true}]}, {"name":"rtt","enabled":true,"mobdesc":"Top"}
]}