Customer Logins
Obtain the data you need to make the most informed decisions by accessing our extensive portfolio of information, analytics, and expertise. Sign in to the product or service center of your choice.
Customer Logins
EQUITIES COMMENTARY
Oct 09, 2020
Securities Finance Q3 2020
We will host two webinars on October 13th, one for the Asia time zone and another for EMEA/Americas. Revenue snapshots for July, August and September are also available.
- Q3 revenues decline by 16% YoY
- Americas Q3 equity revenue decline by 21% YoY
- EMEA, ETF & government bond Q3 revenue increase YoY
- YTD returns decline by 8.7% through September
Global securities lending returns declined by 16% YoY for Q3 to $2.2bn in revenue, the lowest quarterly return since Q1 2017. Lending returns for the quarter varied, from stellar albeit declining returns in July, to the feeling of a virtual stand-still in August, leading to an incremental improvement in September. In the 3rd quarter of 2019, the dominant theme was the return of hard-to-borrow (HTB) equities in the US and Canada; North American equities delivered $1.1bn in Q3 2019 revenues, the most for any quarter since 2008. While the YoY comparison suffers from exceptional returns in 2019, the average Q3 return from 2015 to 2018 was $2.3bn, 4% greater than Q3 2020. From an agency lending perspective, Q3 saw prevailing trends from Q2, namely greater reinvestment returns and utilization, revert toward levels seen prior to the market crash in March. In this note we'll discuss some of the drivers of Q3 revenues and the implications for Q4 and full year 2020 returns.

Through the first half of 2020 revenues totalled $4.78bn, a decline of 4.8% YoY, by a narrow margin the lowest H1 return since 2010. Despite the challenging first half overall, June revenues were solid for equities, with US and Europe each posting the most revenue for any month YTD. Kicking off Q3, July returns were boosted by a variety of factors which rolled over from June, including increased borrow demand for HTB shares in US and Europe, with the latter market also benefitting from delayed dividends which typically would have fallen in Q2. The increased equity revenue steadily faded over the course of July, leading to a moribund August. A September uptick did emerge, though perhaps smaller in magnitude than might have been hoped for given the market volatility combined with increased corporate activity relative to August. In the context of 2020, the $2.2bn in Q3 revenue was similar to the $2.3bn in Q1 returns, falling well short of the $2.5bn in Q2 return. The $6.98bn YTD revenue is 8.7% below the return for the first nine months of 2019.
Agency Lending:

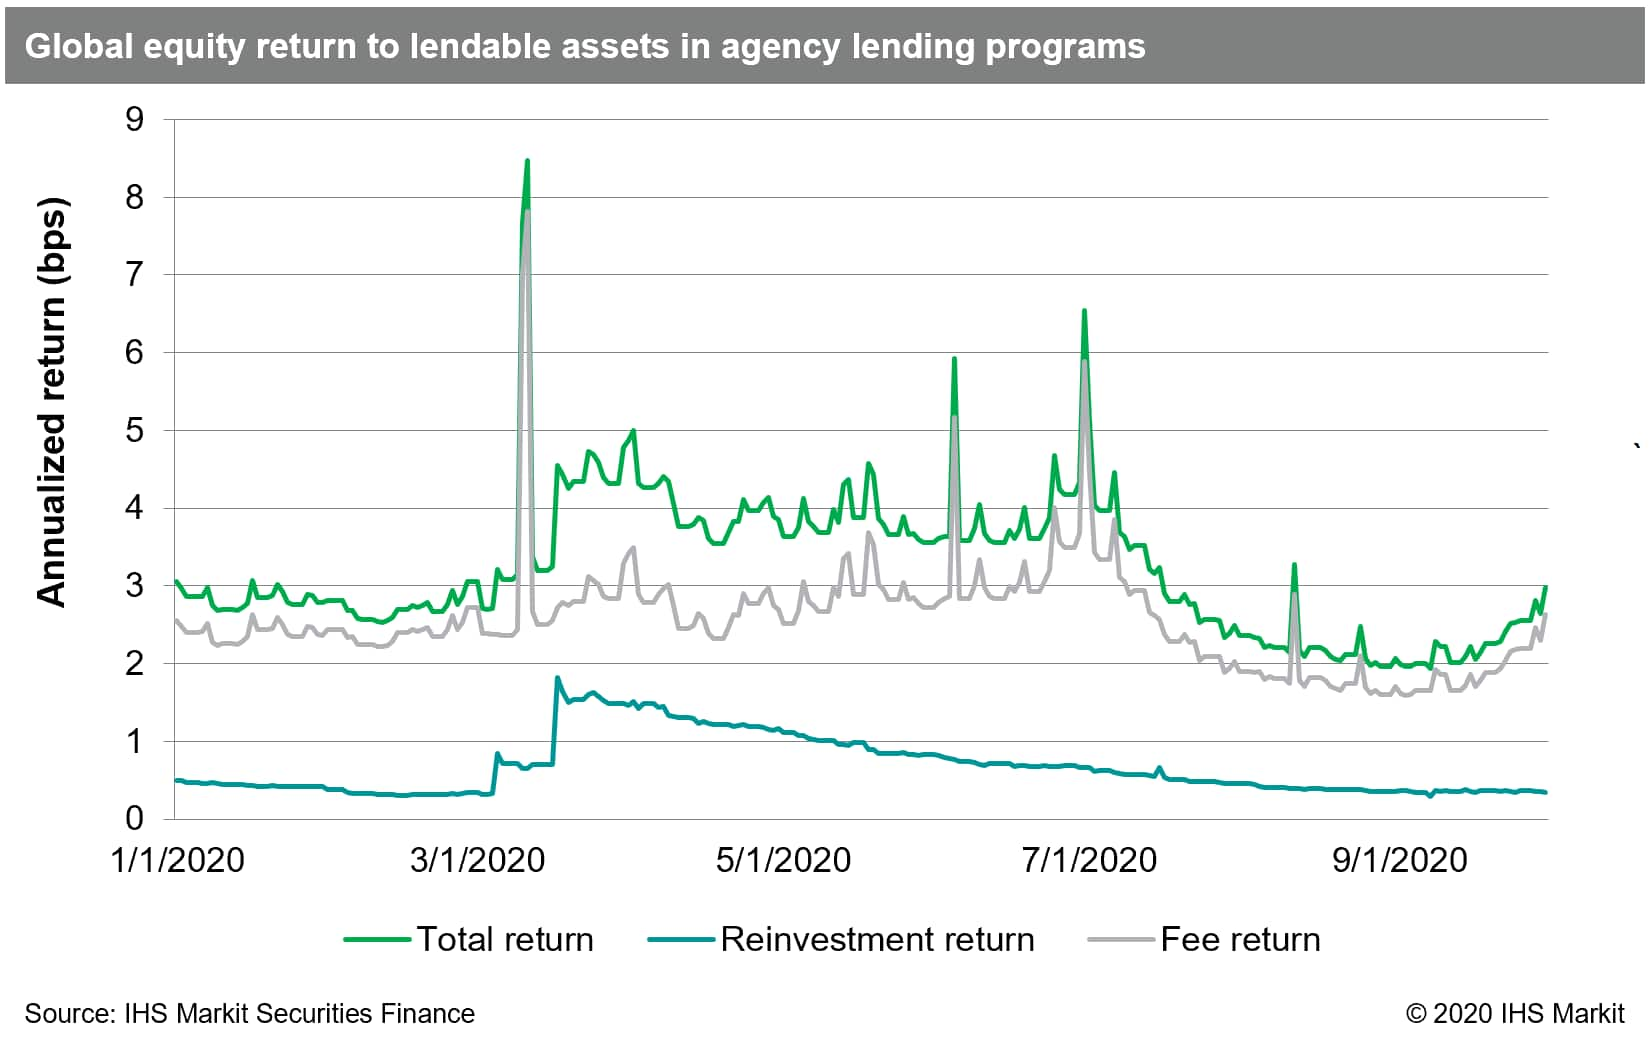
Agency lending revenue for equities totalled just over $1bn for Q3, a 17% YoY decline as the result of lower fee spread returns (SL) set against increased reinvestment returns (RI) for cash collateral lenders. While RI returns are still elevated YoY, the magnitude has decreased substantially since the US Fed rate cut in March (which increased the value of existing reinvestment portfolios as the rebates remitted to brokers declined with interest rates). The September uptick in annualized returns as a percentage of lendable assets, a calculation known as return to lendable (RTL), reversed the majority of the decline from July and August, with RTL nearly back to where to the level at the start of 2020, a return of 3bps annualized.

Apart from declining fee income from the June YTD peak, the downtrend in equity RTL during July and August was also partly the result of increasing lendable asset values, which worked in reverse as equity markets declined in September, while revenues from securities lending fees trended upward from the depths of August.
The return for an MSCI All World index weighted lendable portfolio shows a similar result, with August having the lowest returns YTD, while September mounted a small recovery and most nearly resembled the return from January. HTB shares contributed 70% of the index return in June, a figure which decline to 28% in September, as the number of specials in the index decreased from 23 to 13.

Agency lending of fixed income assets returns have been more heavily reliant on reinvestment of cash collateral YTD, with 54% of return to lendable assets generated by reinvestment through September of 2020, compared with 46% during the first nine months of 2019. While revenues remain elevated on a YoY basis, the trend was downward throughout Q3 both on a spread and reinvestment basis. The Q3 decline was driven by UST securities, while European sovereign lending revenues increased relative to Q2. The fee spread revenue contribution from European issuers increased from 28% in Q2 to 34% in Q3. Agency lending revenues for corporate bonds continues to decline from the peak in 2018, as the supply of lendable assets continues to grow while demand has failed to keep pace.
The return for an iBoxx Global Government Index weighted lendable portfolio shows a similar result, with fee spread returns peaking in Q2 before trending down in Q3, while remaining elevated above 2019 levels. The number of bonds in the index defined as "warm" - meaning they have a fee spread between 35bps - 150bps, decreased from 17 in May to 8 in September.
For agency lending across all securities, the contribution to total return to lendable assets from reinvesting cash collateral fell from 33% in the first half of 2020 to 26% in Q3. Usage of cash collateral generally trended higher over the first half of 2020, as a percentage of all agency loan balances, though the ratio did decline in March given the relatively higher proportion of cash collateral loans in equities where the loan balances were more impacted by the market decline; From late-July through September the usage of non-cash increased relative to cash, particularly for equities.
Exchange Traded Products:
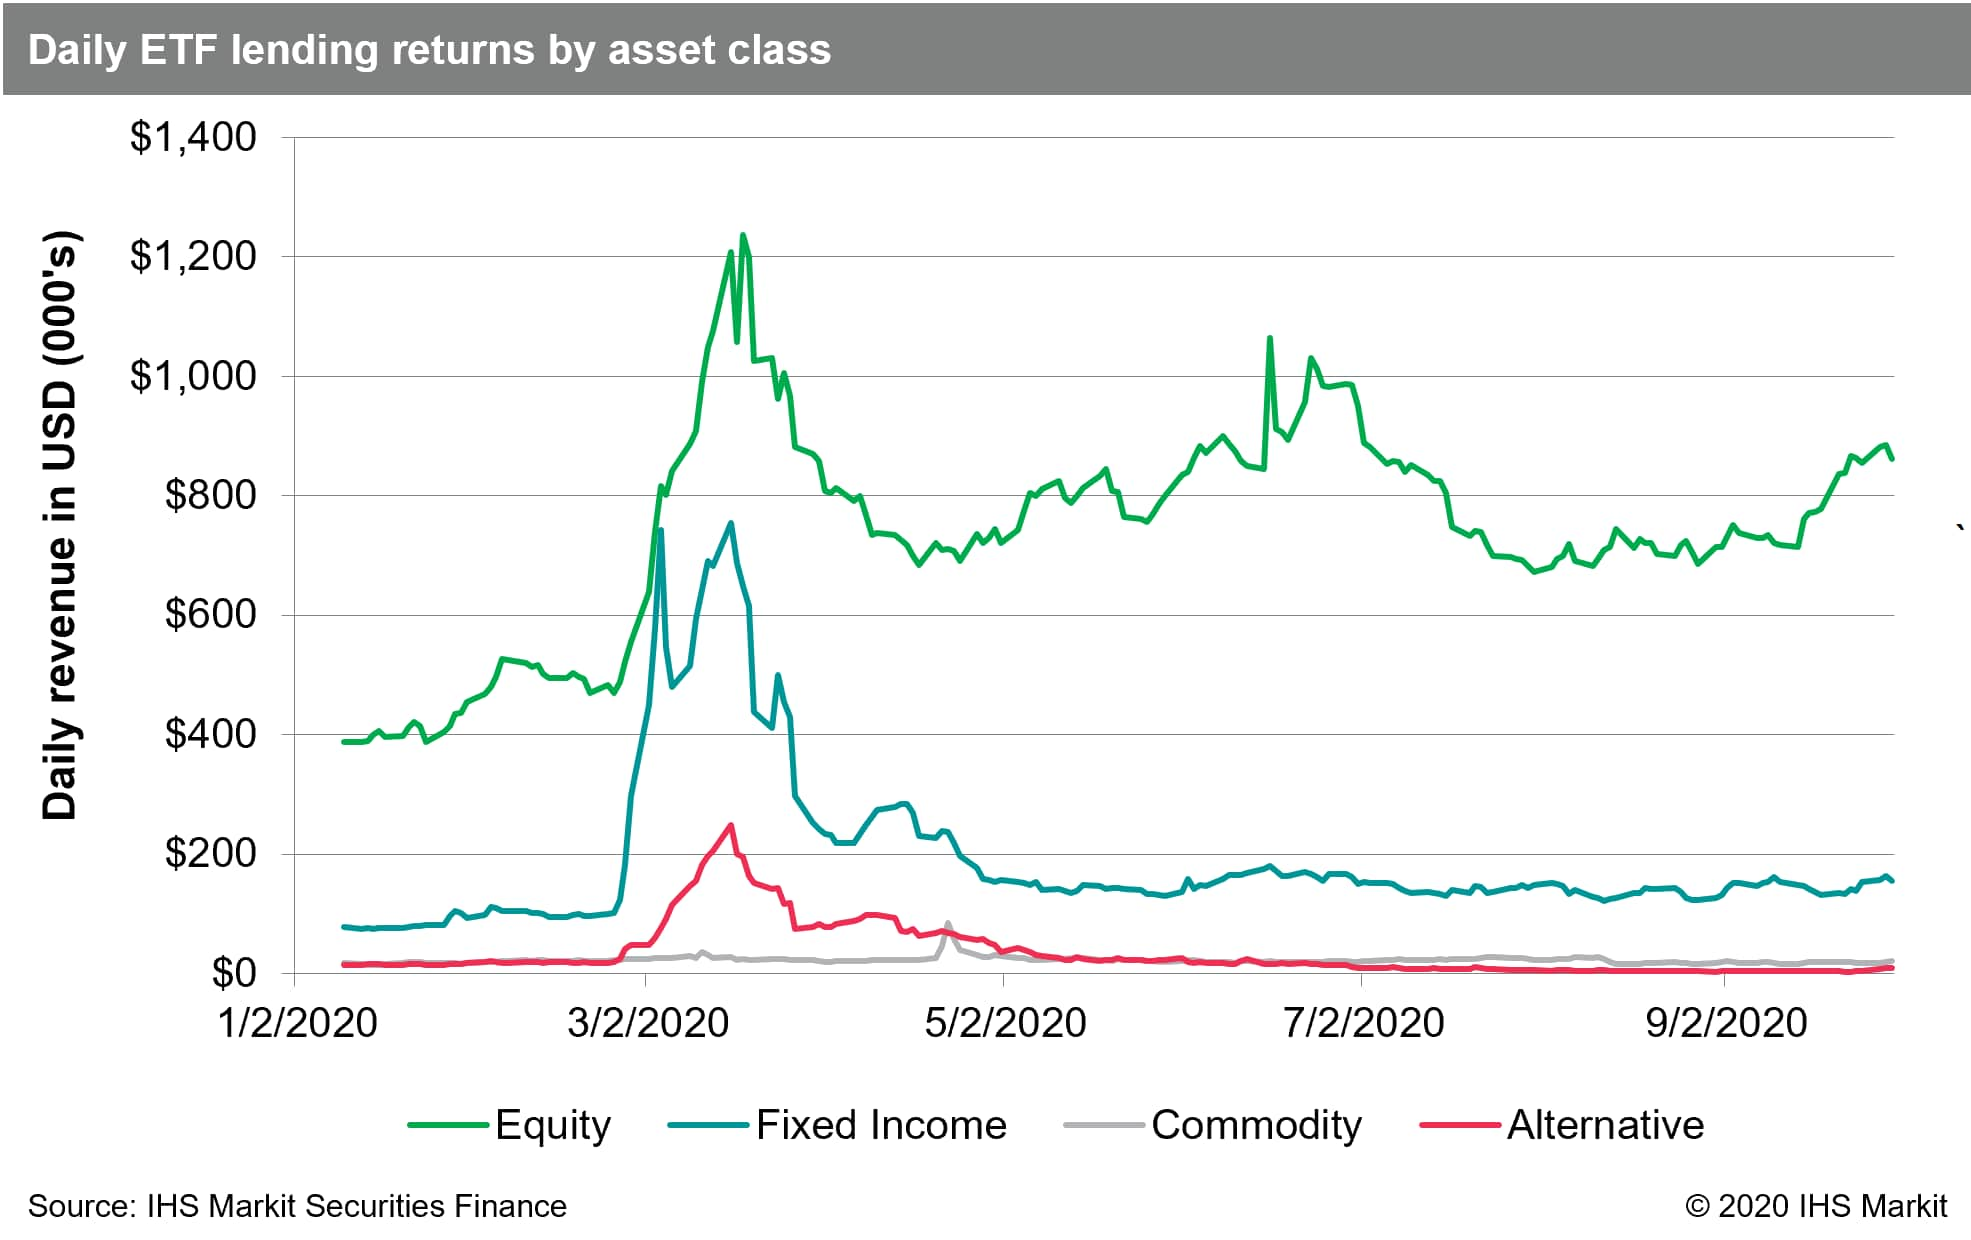
Global ETF revenues were $92.4m for Q3, a 20% YoY increase, driven by a 7% increase in average on-loan balances and an 11% increase in fees. In the context of 2020, Q3 ETF lending returns declined 10% compared with Q2, mostly the result of declining loan balances though fees also declined. Equity ETF revenue trended higher in September which, along with an increase in high-yield and loans products in the last days of the month, may set the stage for further growth in Q4. Utilization of ETF lendable assets also increased in September, as lendable values declined with equity markets while loan balances increased.

Global Equities:
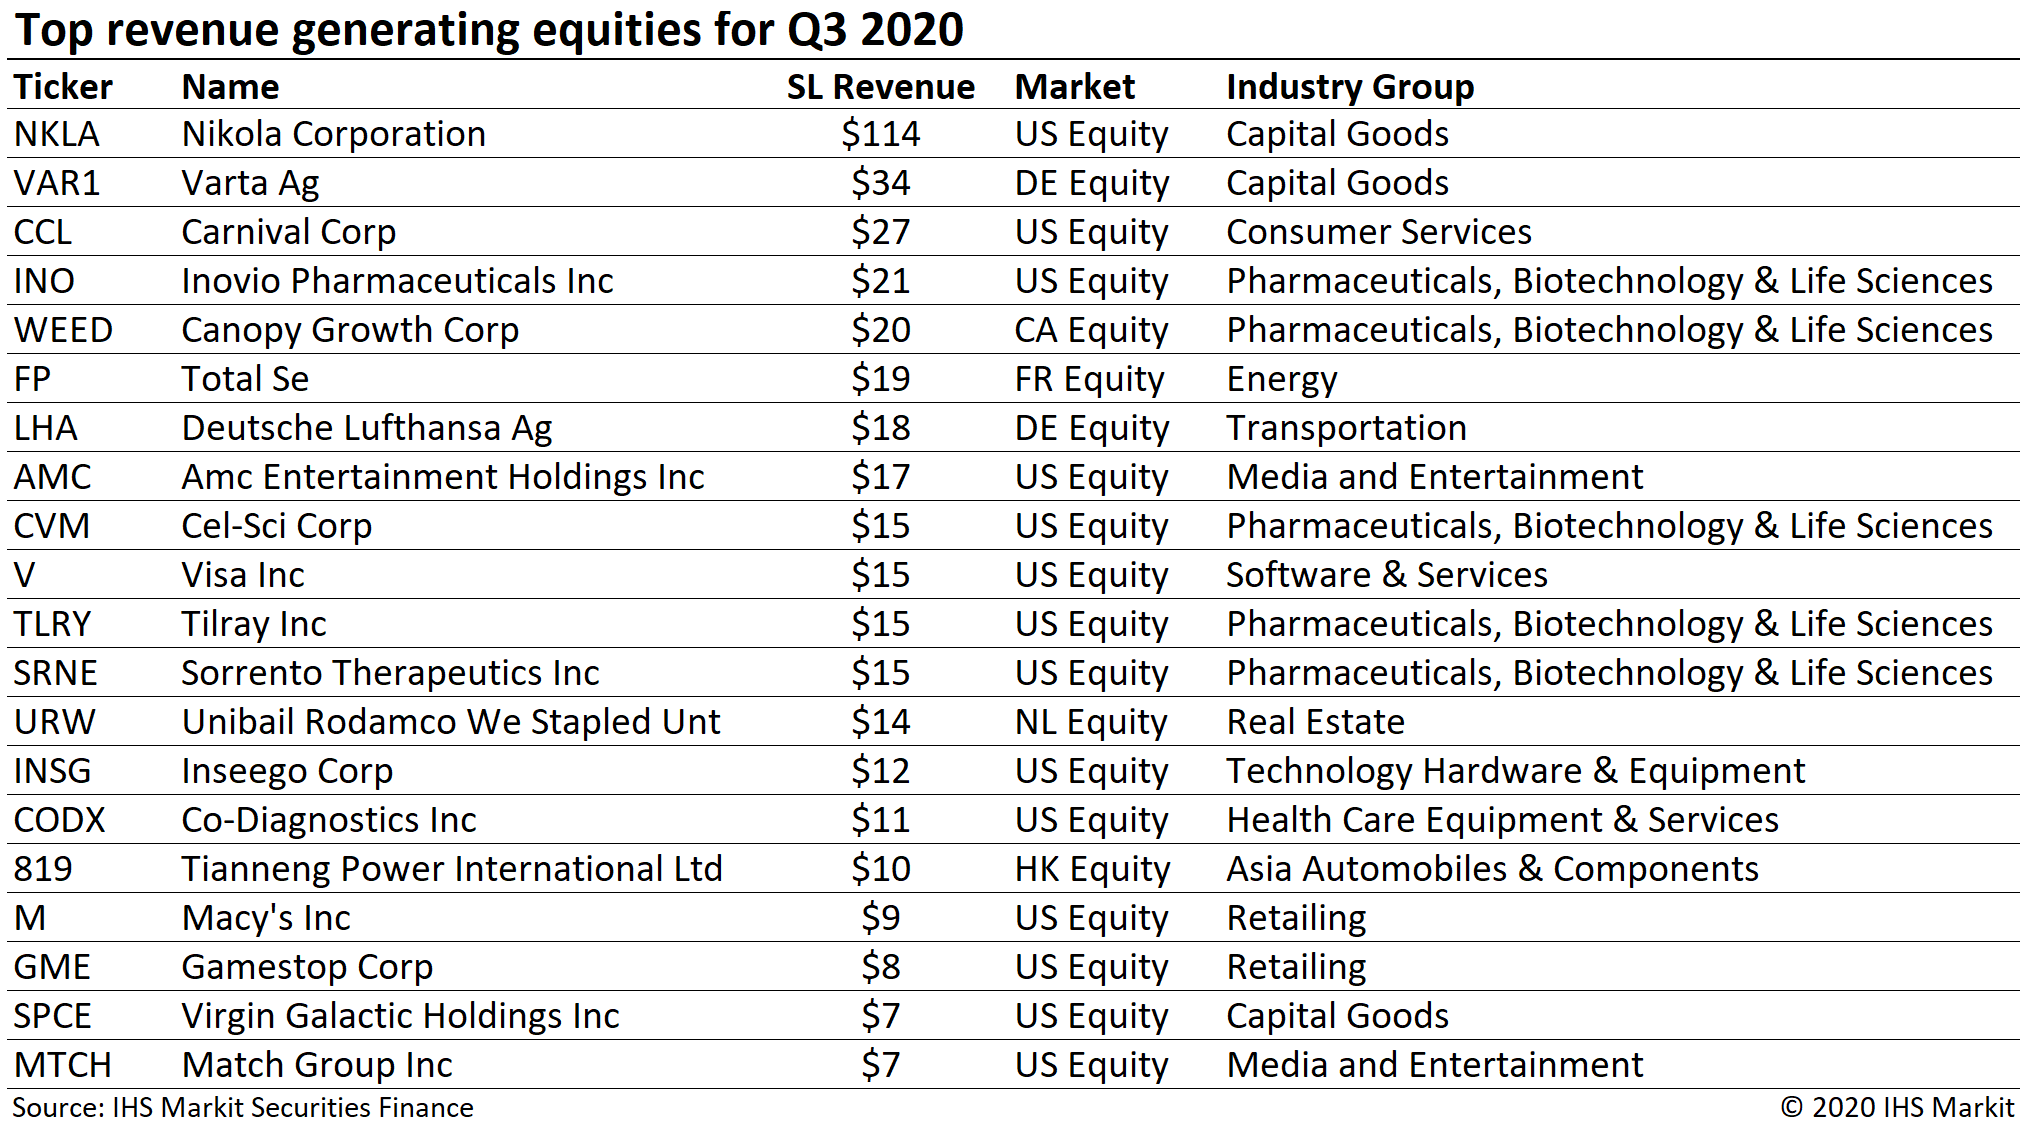
The most revenue generating security in Q3 was Nikola Corporation; the shares delivered astounding revenue in July, around the conversion of outstanding warrants, and then again in September following the release of a short-biased research note ahead of a looming lockup expiry in November. While the $114m in Q3 revenue for NKLA shares is impressive, it pales in comparison with shares of Beyond Meat Inc, which delivered $198m in Q3 2019 returns. Excluding the impact of the top earner from each year, the rest of the top 10 delivered $187 in 2020, a 40% decline from $311m in 2019.

US equities delivered $790m in Q3 revenues, a 14.5% YoY decline. The challenging environment for US equity long-short managers in 2020 wasn't made any easier in September, with the most expensive to borrow shares outperforming the average US equity, after two consecutive months of underperformance in July and August. The second quarter was particularly brutal for returns relating to short interest or securities finance metrics, with crowded shorts markedly outperforming during the April and June rallies; it's notable that the relative outperformance in September is against a backdrop of the broader market decline. While a certain amount of the special balances relate to corporate action or capital structure related trades, the challenging environment for crowded directional shorts in June likely made some contribution to declining specials balances in July and August. Further outperformance may dampen demand for crowded directional shorts in going forward, however the trend in specials balances was to the upside over the course of September on a mix of drivers including recent IPOs ahead of lockup expiries, directional shorts and convertible bond issuers. Canadian equities delivered $90m in Q3 revenue, a 52% YoY decline. As noted in the September revenue snapshot, the third quarter of 2019 was particularly strong for Cannabis related equities, which failed to repeat in 2020, largely the result of increased share issuance.
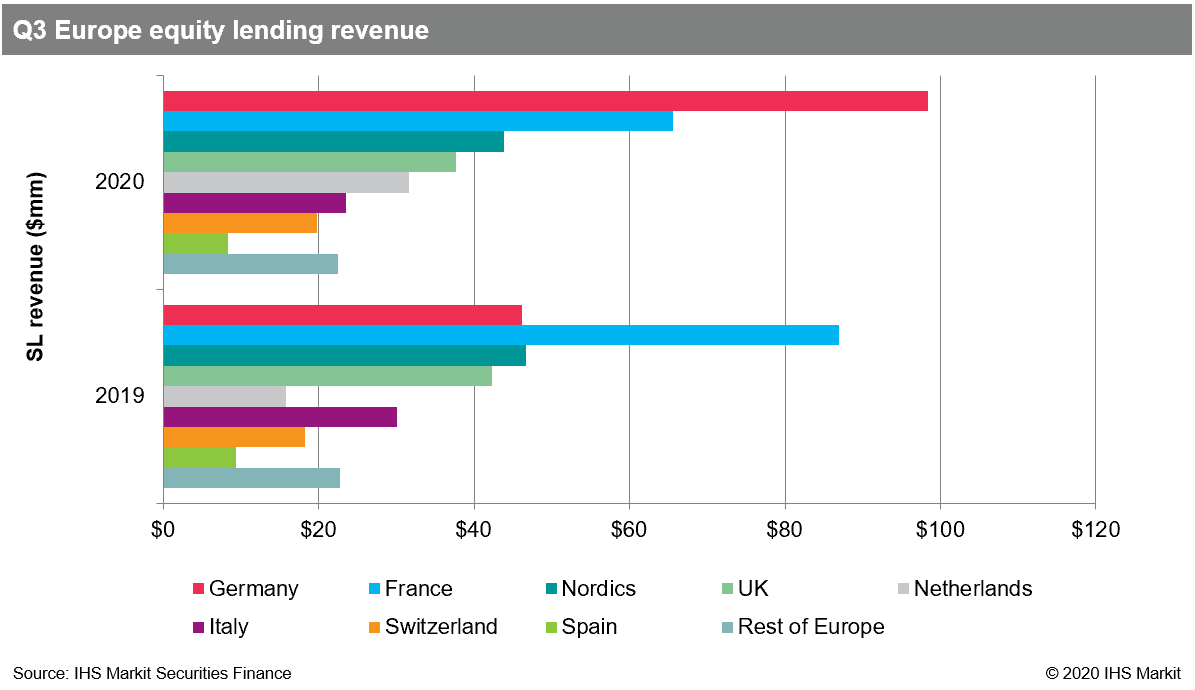
European equities delivered $351 in Q3 revenue, a 10.3% YoY increase. The revenue increase was heavily concentrated in Germany and the Netherlands, where Q3 revenues increased 112% and 100% YoY, respectively. Excluding the impact of the two standout markets, the rest of Europe saw revenues decline by 14% YoY.

Asia equity lending revenue maintained the downward trajectory it has been on throughout 2020 during the third quarter. The $363m in revenue generated in Q3 reflects a 24% decline YoY and is the lowest for the region in any quarter since Q4 2015. Hong Kong has been the bright spot in the region, with $80m in Q3 revenues reflecting a 16% YoY increase, though 8% below the Q2 return. Revenues for the largest market in Asia, Japan, remain well below 2019 returns, with Q3 delivering $159m, a 27% YoY decline. While the total revenue remains relatively low, ETFs listed in Asia continue to see elevated borrow returns compared with 2019; Q3 returns for Asia ETFs came in at $8.4m, an increase of 53% YoY.
Conclusion:
The contribution to equity returns from the 10 most revenue generating securities fell from 24% in Q3 2019 to 17% in Q3 2020. Total equity revenue declined by 18% YoY and would have declined even if the impact of the top 10 were excluded from both years. Equity utilization reached a new post-GFC low the first week of September 2020, 3.78%, with the previous record low having been observed in January. Equity utilization soared in March but steadily trended down thereafter. If Q4 2020 equity returns can match 2019 that would result in FY revenues of $7.5bn, a 7% YoY decline. That result will require a significant uptick in equity revenue, which ended September at an annualized run rate 24% below September 30th, 2019.
Through September, most asset classes have experienced at least some period of underperformance compared with 2019. Revenues in Asia and Europe were partly held back by short sale bans, which have largely run their course, however, EU returns also suffered from dividend cuts whose revival going forward remains uncertain. US equities generated substantial returns in Q2, but demand for specials declined substantially in July and August and remains well below the June peak. ETF revenues have declined from the peak in March, though, that has mainly been a function of declining fees for a few high-yield products, a trend which may be changing course, while equity ETF returns have spent most of the year elevated relative to 2019. Borrow demand for government bonds remains robust, however, the reinvestment tailwind for cash lenders has substantially subsided. Heading into Q4 it appears almost inevitable that FY 2020 fee-based revenue for the industry will lag 2019, despite Americas equities, government debt and ETF managing to increase returns YTD. It is worth noting that total returns for agency lending across all securities, including the reinvestment return, was 0.9% greater for the first 9 months of 2020 than 2019.
S&P Global provides industry-leading data, software and technology platforms and managed services to tackle some of the most difficult challenges in financial markets. We help our customers better understand complicated markets, reduce risk, operate more efficiently and comply with financial regulation.
This article was published by S&P Global Market Intelligence and not by S&P Global Ratings, which is a separately managed division of S&P Global.
{"items" : [
{"name":"share","enabled":true,"desc":"<strong>Share</strong>","mobdesc":"Share","options":[ {"name":"facebook","url":"https://www.facebook.com/sharer.php?u=http%3a%2f%2fstage.www.spglobal.com%2fmarketintelligence%2fen%2fmi%2fresearch-analysis%2fsecurities-finance-q3-2020.html","enabled":true},{"name":"twitter","url":"https://twitter.com/intent/tweet?url=http%3a%2f%2fstage.www.spglobal.com%2fmarketintelligence%2fen%2fmi%2fresearch-analysis%2fsecurities-finance-q3-2020.html&text=Securities+Finance+Q3+2020+%7c+S%26P+Global+","enabled":true},{"name":"linkedin","url":"https://www.linkedin.com/sharing/share-offsite/?url=http%3a%2f%2fstage.www.spglobal.com%2fmarketintelligence%2fen%2fmi%2fresearch-analysis%2fsecurities-finance-q3-2020.html","enabled":true},{"name":"email","url":"?subject=Securities Finance Q3 2020 | S&P Global &body=http%3a%2f%2fstage.www.spglobal.com%2fmarketintelligence%2fen%2fmi%2fresearch-analysis%2fsecurities-finance-q3-2020.html","enabled":true},{"name":"whatsapp","url":"https://api.whatsapp.com/send?text=Securities+Finance+Q3+2020+%7c+S%26P+Global+ http%3a%2f%2fstage.www.spglobal.com%2fmarketintelligence%2fen%2fmi%2fresearch-analysis%2fsecurities-finance-q3-2020.html","enabled":true}]}, {"name":"rtt","enabled":true,"mobdesc":"Top"}
]}


