Customer Logins
Obtain the data you need to make the most informed decisions by accessing our extensive portfolio of information, analytics, and expertise. Sign in to the product or service center of your choice.
Customer Logins
EQUITIES COMMENTARY
Oct 13, 2021
Securities Finance September 2021 Snapshot
Please join us for the Q3 securities finance webinar on Tuesday, October 19th, where we will discuss revenue trends and will be joined by special guest Eric Lytle of Charles Schwab & Co., to discuss his views on market trends from the perspective of a US retail broker-dealer.
- September revenues increased by 46% YoY
- APAC equity revenue rebound in-tact
- Most monthly corporate bond lending revenue YTD
- ETP & ADR borrow demand remains robust
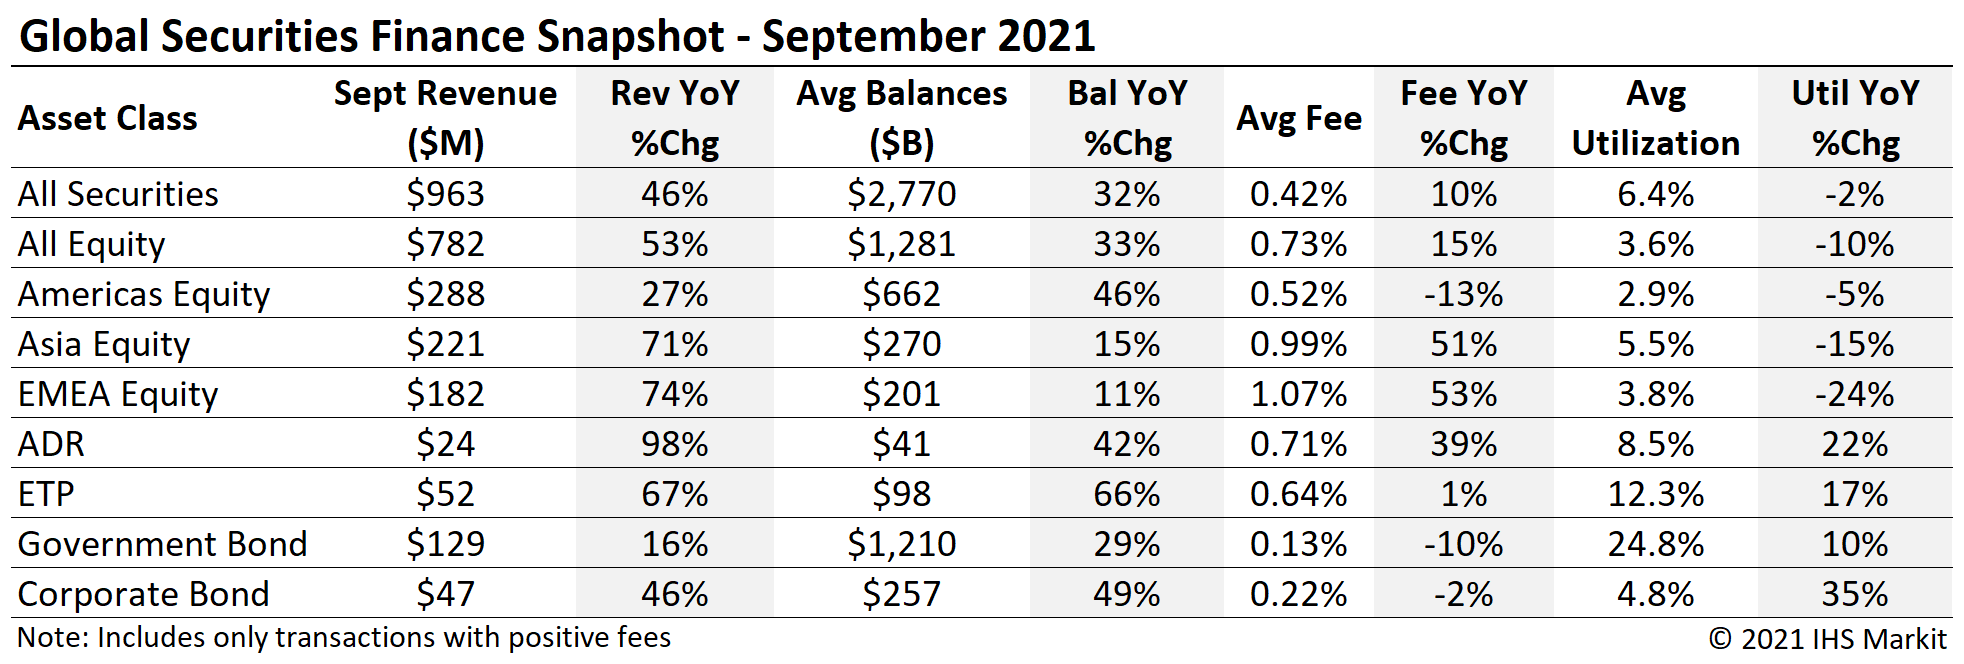
Global securities finance revenues totaled just over $963m in September, a 46% YoY increase. The comparison with 2020 remained favorable in September, partly owing to a particularly remunerative arbitrage related trade in EMEA. In general, return drivers which were in place for the first two months of Q3 continued to play out in September, including lockup expiries for recent IPOs; some other drivers include increased borrow demand for corporate bonds and related exchange traded products, the uptrend in APAC equity special balances and corporate action event related trades. In this note we'll discuss the drivers of September revenue, which pushed total Q3 revenues to $2.75b, a 23% YoY increase.
APAC Equity
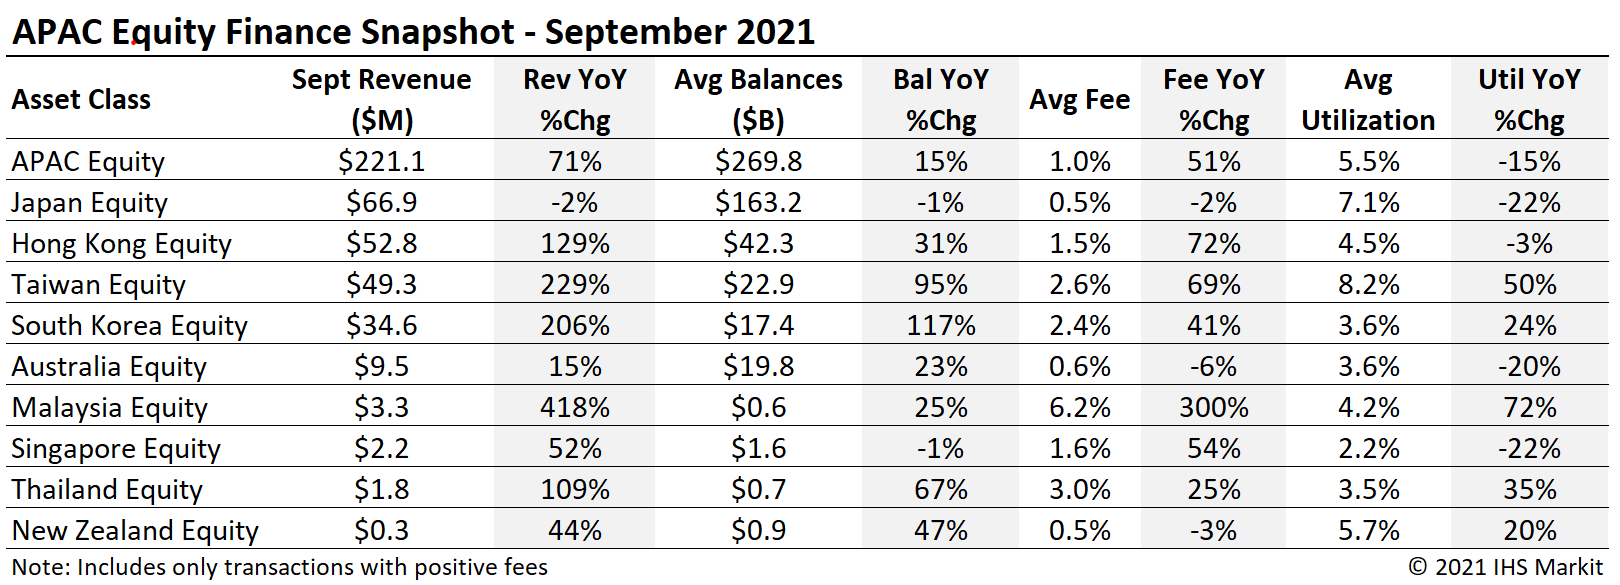
APAC equity finance revenues totaled $221m for September, a 71% YoY increase and the most revenue for any month YTD. The upswing in September revenues was broad based with the emerging market revenue upswing remaining in-tact, while the Japanese market benefitted from seasonal impacts.
APAC equity special balances declined by 12.5% MoM, the 2nd consecutive month to see a MoM decline following four consecutive months of MoM increases from April to July. Despite the MoM decline, September's $12.1bn in APAC equity special balances remains 20% above the average for the first six months of 2021. Special balances are defined in this note as balances with a fee greater than 500bps.

Elevated borrow demand for Taiwan equities continues to deliver lending returns for shareholders, with $49m in September revenue reflecting a 229% YoY increase. Four of the top ten most revenue generating APAC equities are listed on the Taiwan Stock Exchange, a larger representation than any other country in the region.
Hong Kong SAR equity finance revenues totaled $52.8m for September, the most revenue for any month YTD. Most equity finance metrics showed YoY growth for the HK market, though lendable assets grew by more than loan balances causing utilization to decline. The most revenue generating HK equity in September was WH Group Ltd (288 HK), which delivered $17.8m of revenue. China Evergrande Group was the top earner in August but the decline in share price along with declining shares on loan over the last two weeks of September offset the soaring fee for borrow.

Japan equity finance revenues totaled $66.9m in September, a decline 1.9% YoY as a result of from declining loan balances and fees. Monthly returns were boosted by borrow demand around dividend record dates, an impact sufficient to make Japan the top earning equity finance market in APAC for September.
South Korea equity revenue totaled $34.6m for September, sufficient for a 206% YoY increase, though that is mostly a measure of the impact of the short sale ban in 2020. SK equity finance revenues declined by 0.9% MoM, reflecting stable, if slightly declining, specials balances.
Americas Equity
Americas equity revenues came in at $288m for September, a 27% YoY increase, though average daily revenues declined by 4% MoM. The YoY comparison is driven by a particularly quiet September 2020, which delivered the third lowest monthly revenue of that year; the YoY comparison hurdle will present a greater challenge in Q4. America's average equity special balances declined by 11% MoM, with September having the lowest average since March when using 500bps as a cutoff for special balances. The decline in specials balances in August and September have resulted in the Americas representing only 36% of global equity special balances, the lowest ratio observed YTD.
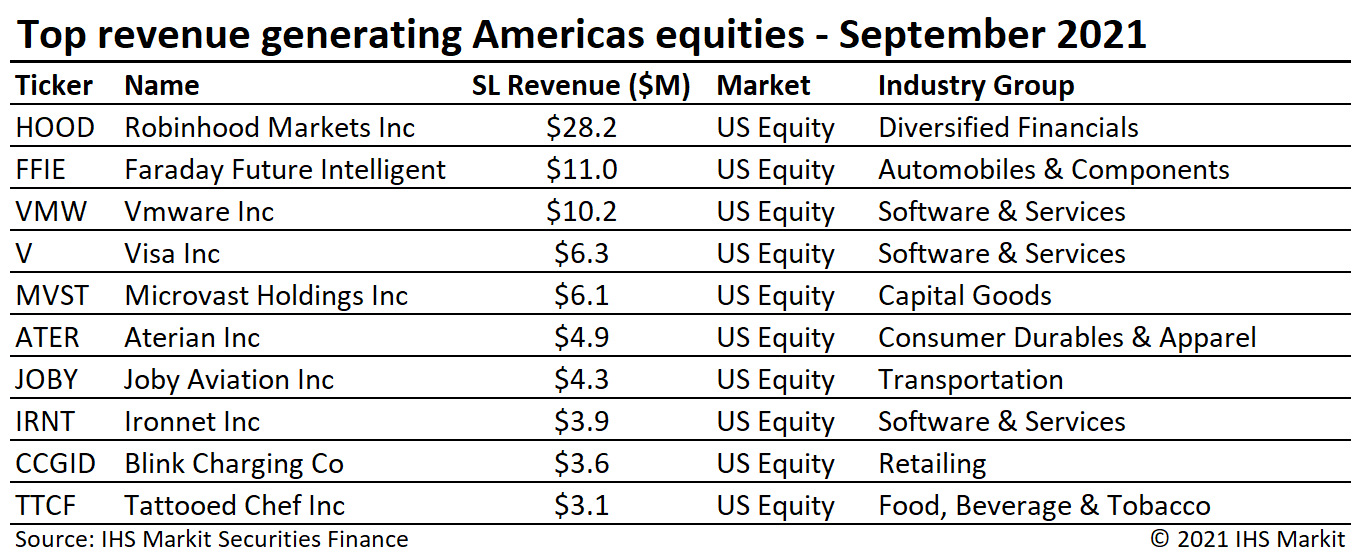
US equity revenues came in at $262m for September, a 30% YoY increase and a 6% MoM decline in average daily revenue. The MoM decline in September is a result of less revenue related to unlocking restricted shares compared to August, when Lucid Group Inc. (LCID) and Coupang Inc. (CPNG) combined for $58m in revenue ahead of their lockup expiries. The largest contributor to September was a 2021 vintage IPO, Robinhood Markets Inc (HOOD), which was likely driven in part by an upcoming lockup expiry in late October.
Canadian equity lending revenue of $25.3m reflected a 1.6% YoY increase for September. The revenue growth was driven by a steady increase in on-loan balances throughout the month as well as a pair of dividend record dates falling in the last week of the month. CA equity specials balances averaged $674m, the highest monthly average since June.
European Equity
European equity returns totaled $182.5m for September, an increase of 74.3% YoY. The soaring revenue was primarily the result of the Vivendi Se (VIV) spin-off of Universal Music Group Nv (UMG), which delivered just over $100m in September revenue, making it a likely candidate for top earning EMEA equity of 2021, taking the title from Varta Ag (VAR1) which delivered $98m in 2020 revenue. Spin-off transactions where there is a tradable security for the business being spun can be particularly lucrative for lenders given that an arbitrage trade can be achieved with access to lendable shares, so the lending revenue effectively represents a split of the profit between the arbitrageur and long shareholder. EMEA equity finance revenues would have declined by 22% YoY if the impact of lending Vivendi shares were excluded.

German equity revenues of $18.5m reflect a 40% YoY decline for September. The top three revenue generating German equities continue to be Deutsche Lufthansa Ag (LHA), Grenke Ag (GLJ) & Varta Ag (VAR1); however, the trio delivered only $9m in September revenue, the lowest monthly total of Q3.
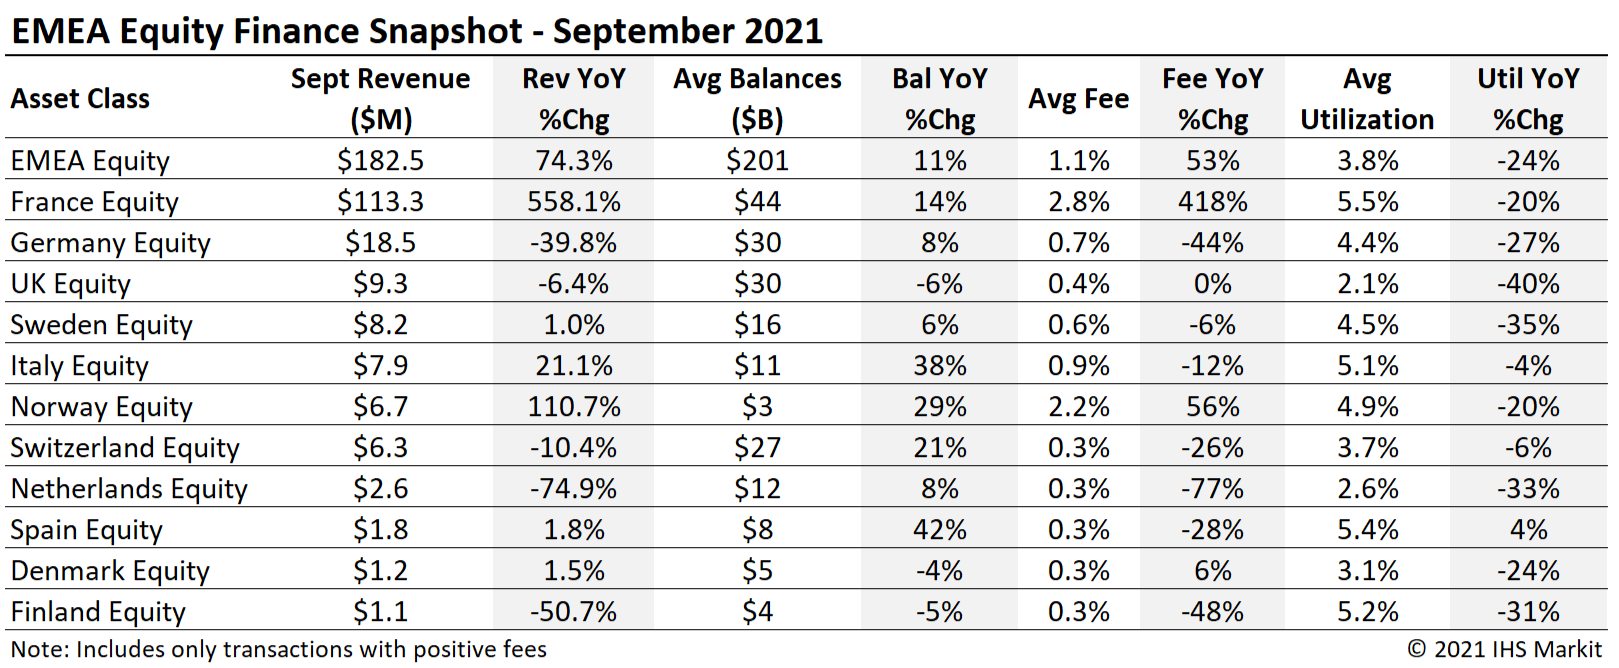
The surge in revenue for French equities was entirely the result of the Vivendi spin-off, as returns declined by 27% YoY in September excluding that trade. UK equity revenues declined by 6.4% YoY, with the top earner continuing to be Tui Ag; shares for the travel and tourism firm are partly impacted by the firm's convertible bond, which helps to explain the dip in borrow demand in early September, when the equity share price declined, and an increase in borrow demand as the share price rallied over the last two weeks of the month (borrow demand for convertible hedges generally has a positive correlation to share price, as value in the embedded call option increases with the share price).
Depository Receipts
Revenues from lending American Depository Receipts (ADRs) increased 98% YoY, totaling $24.4m in September, extending the broad YoY revenue uptrend. ADR revenues increased by 19% MoM after a quiet August which delivered the least monthly revenue YTD. The MoM upswing was driven by Bitcoin mining firm Bit Mining (BTCM) ADR listing, which delivered $8.9m in September because of extreme borrow fees, increasing shares on loan and a volatile share price. August average ADR loan balances of $41.2bn reflect a 42% YoY increase and a 4% MoM increase.

Exchange Traded Products
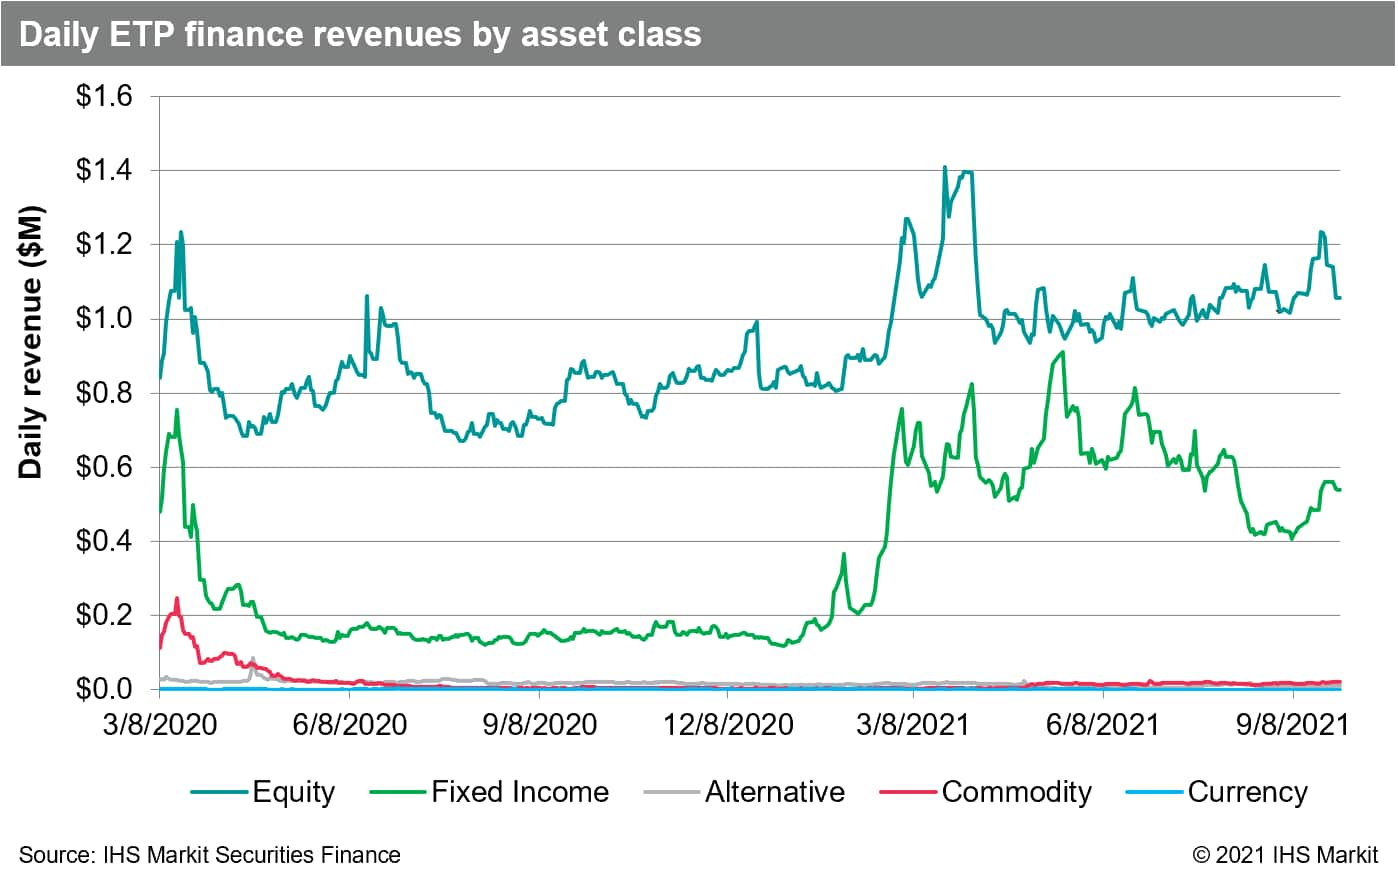
Global ETP revenues totaled $52m for September, a 67% YoY increase. Despite the strong YoY comparison, it's worth noting that revenues were essentially flat MoM, declining by 0.6%. The ETP lendable asset value set a new all-time monthly average high of $488bn; however, YoY loan balance growth has kept utilization well above 2020 levels since June. Revenues for fixed income products decreased by 9% MoM, a result partly driven by declining fees and loan balances for the iShares iBoxx $ Investment Grade Corporate Bond Fund (LQD). The most revenue generating exchange traded product continues to be the iShares iBoxx $ High Yield Corporate Bond Fund (HYG), which returned more than double the next ranked product. The Ark Innovation ETF (ARKK) continues to deliver lending revenue for investors, with borrow costs increasing in September partly as a result of the funds holding of Robinhood shares. ETP specials balances were steady in September, with an average on-loan balance with a fee greater than 500bps averaging $1.28bn, a decline of 2.3% MoM.

Corporate Bonds
The uptrend in corporate bond finance revenues remained in place through September, which delivered the most monthly revenue YTD, $47.4m, a 46% YoY increase. Corporate loan balances averaged $257b in September, an increase of 49% YoY and the largest monthly average balance YTD.

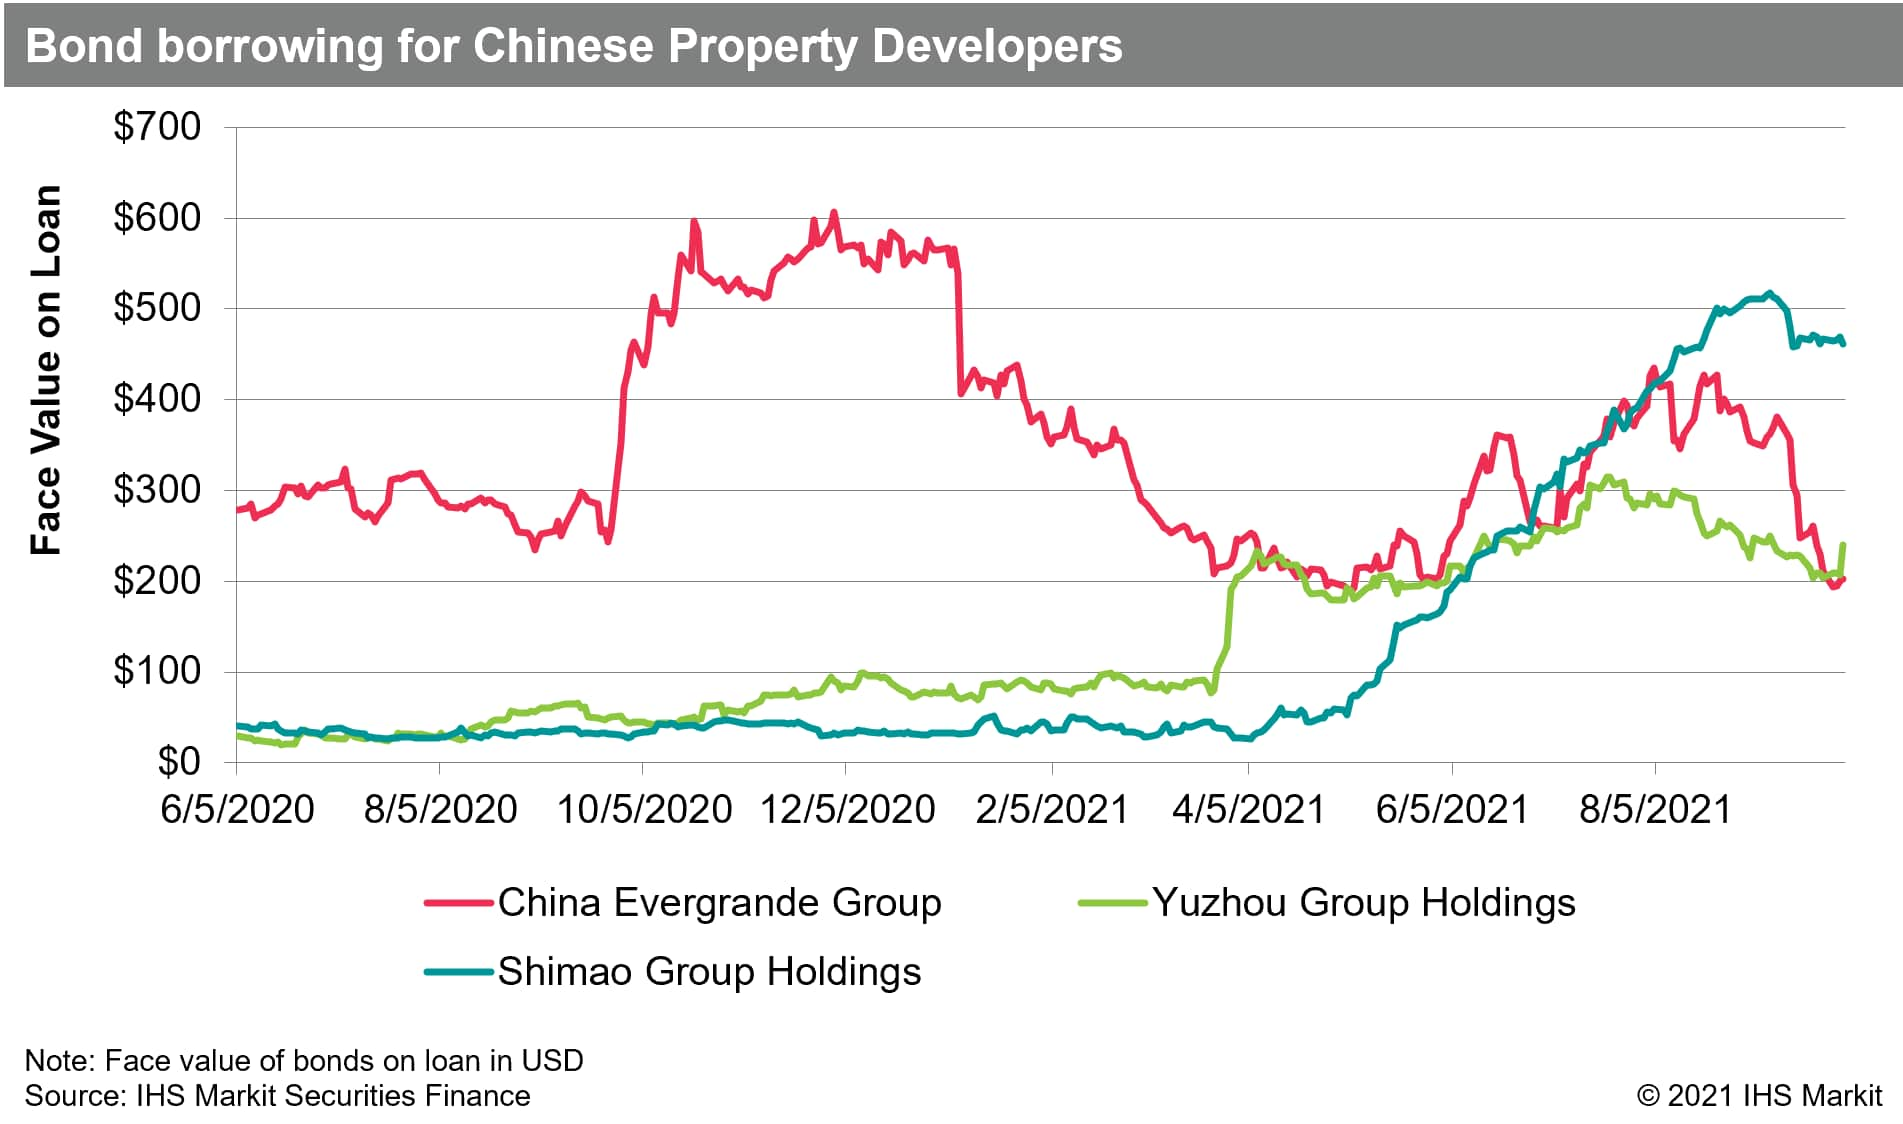
Chinese property development firms have seen cross-over borrow demand for equity and credit, notably including China Evergrande Group, though the revenue for lending bonds issued by Evergrande has been subdued by the decline in the value of bonds on loan driven both by lower prices and a declining face value on loan. One Chinese developer whose bonds trade closer to par yielded one of the top five most revenue generating corporates for September, Shimao Group Holdings.
Total corporate bond lending revenues for agency programs, including reinvestment returns and negative fee trades, increased by 22% YoY as the result of a 54% YoY increase in intrinsic fee income and a 21% decline in daily reinvestment returns.
Government Bonds
Fee-spread revenues of global sovereign debt totaled $129.4m for August, a 15.5% YoY increase and a 3% MoM decline. Government bond borrow demand remains robust, with $1.21T in positive-fee global balances for August, reflecting an 29% YoY increase. The $269bn YoY increase in positive-fee balances is the result of a $245bn YoY increase in total on-loan balances along with $78bn moving from negative to positive fee.
Total government bond lending revenues for agency programs, including reinvestment returns and negative fee trades, increased by 0.3% YoY as the result of narrower reinvestment spreads, with intrinsic fee revenue increasing by 22% YoY.

US government bond lending revenue came in at $68m for September, an 8% YoY increase, though falling short of the August return with September the lowest revenue month YTD. Returns from lending European sovereigns were $44m for September, a 15% YoY increase.
Conclusion
Global securities finance revenues increased by 46% YoY in September, the largest percentage gain YTD. The solid September came after August, which delivered the 2nd largest YoY increase. The YoY comparisons are driven by a relatively quiet period in markets at the end of summer 2020, but the relative upswing is welcomed regardless. EMEA equity finance revenues suffered a lack of specials during the summer; however, the Vivendi spin-off was a blockbuster and a perfect example of a trade which could justify participating in a lending program even if only for special one-off opportunities. Lock-up expiries continued to play a role in September, as reflected on the leader board for US equity revenue generators, and that's likely to remain a driver with expiries coming up in October. The usage of exchange traded products in institutional long portfolios and for short hedges continues to boost returns, though demand for some fixed income products has declined. Borrow demand for corporate bonds continues to increase with six consecutive months of YoY increases in intrinsic income, with September having the most monthly revenue YTD. With drivers of lending returns from the first half of the year continue to play out along with some new themes, Q3 concluded with $2.75bn in global financing revenue, a 23% YoY revenue increase.
Stay tuned for monthly revenue snapshots from IHS Markit Securities Finance!
S&P Global provides industry-leading data, software and technology platforms and managed services to tackle some of the most difficult challenges in financial markets. We help our customers better understand complicated markets, reduce risk, operate more efficiently and comply with financial regulation.
This article was published by S&P Global Market Intelligence and not by S&P Global Ratings, which is a separately managed division of S&P Global.
{"items" : [
{"name":"share","enabled":true,"desc":"<strong>Share</strong>","mobdesc":"Share","options":[ {"name":"facebook","url":"https://www.facebook.com/sharer.php?u=http%3a%2f%2fstage.www.spglobal.com%2fmarketintelligence%2fen%2fmi%2fresearch-analysis%2fsecurities-finance-september-2021-snapshot.html","enabled":true},{"name":"twitter","url":"https://twitter.com/intent/tweet?url=http%3a%2f%2fstage.www.spglobal.com%2fmarketintelligence%2fen%2fmi%2fresearch-analysis%2fsecurities-finance-september-2021-snapshot.html&text=Securities+Finance+September+2021+Snapshot+%7c+S%26P+Global+","enabled":true},{"name":"linkedin","url":"https://www.linkedin.com/sharing/share-offsite/?url=http%3a%2f%2fstage.www.spglobal.com%2fmarketintelligence%2fen%2fmi%2fresearch-analysis%2fsecurities-finance-september-2021-snapshot.html","enabled":true},{"name":"email","url":"?subject=Securities Finance September 2021 Snapshot | S&P Global &body=http%3a%2f%2fstage.www.spglobal.com%2fmarketintelligence%2fen%2fmi%2fresearch-analysis%2fsecurities-finance-september-2021-snapshot.html","enabled":true},{"name":"whatsapp","url":"https://api.whatsapp.com/send?text=Securities+Finance+September+2021+Snapshot+%7c+S%26P+Global+ http%3a%2f%2fstage.www.spglobal.com%2fmarketintelligence%2fen%2fmi%2fresearch-analysis%2fsecurities-finance-september-2021-snapshot.html","enabled":true}]}, {"name":"rtt","enabled":true,"mobdesc":"Top"}
]}


