Customer Logins
Obtain the data you need to make the most informed decisions by accessing our extensive portfolio of information, analytics, and expertise. Sign in to the product or service center of your choice.
Customer Logins
EQUITIES COMMENTARY
Nov 06, 2019
Securities Lending Q3 Review
Global markets see $2.6bn in securities lending revenue:
- Equity specials in North America drive revenue growth
- Asia and Europe see declining equity revenues
- Declining fixed income fees weigh on returns
Global securities lending revenues for Q3 2019 were $2.6bn, 4.7% above Q3 2018 revenue. That makes Q3 the first quarter of 2019 to deliver YoY revenue growth. Increasing demand for hard to borrow equities in US and Canada resulted in the highest quarterly revenue for North American equities since 2008 ($1.1bn). The weighted average fee across all asset classes increased by 12% YoY – while increasing fees supported the revenue growth, the 7% YoY decline in loan balances served as a drag on returns.

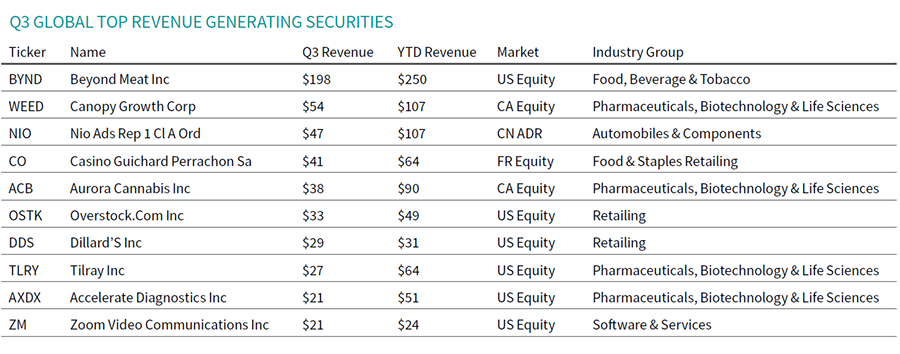
In the Q2 update, we noted the pickup in equity specials demand in May and June, which was encouraging given the overall shortfall in equity lending revenues in the first half of the year. The big story of Q3 was continued increase in North American equity specials balances and fees. The upswing largely came as the result of IPOs and Cannabis related equities. Beyond Meat has undoubtedly been the outstanding security of the year in terms of revenue, with eye-popping fees paid by borrowers on what is now one of the largest US equity short positions in nominal terms. Total revenues for lending BYND shares are easily the highest for any security YTD ($250m), an impressive feat given the firm didn’t IPO until the first week of May.

The boost in specials related revenue helped deliver $924m in Q3 US equity lending revenue, the most for any quarter since Q3 2008’s $1.1bn record. The Q3 US equity returns narrowly edged out Q4 2015 and Q1 2016, which both had just over $900m.
Total equity lending revenues came in at $2.1bn, an 11% percent increase compared with Q3 2018. All the growth was in North America, with the rest of the world seeing a 13% decline in equity revenues. North American equities delivered 42% of all securities lending revenues in Q3, the highest ratio since Q4 2015.
Revenues in Asia were down 14% YoY as the growth in value on loan was insufficient to cover the decline in average fees. It’s worth noting however that there was a 1.5% increase sequentially compared with Q2. The YoY revenue shortfall was concentrated in emerging markets and was driven by declining demand and fees. The top 10 Asian equities returned $61m in Q3 revenues, down from $76m in Q2. Revenues in Japan declined 1.3% YoY, belying a 29% increase in balances and nearly offsetting decline in fees.
European equity lending revenues declined 13% YoY in Q3, as the result of a 20% decline in balances and an 8% increase in fees. The standout security in the region for Q3 was Casino Guichard Perrachon: fees soared on a decrease in lendable assets and balances increased with the 46% increase in the share price. As a result of the surging Casino revenues, French equities delivered the most Q3 revenue since 2012 ($86m). UK equities were the only major EU market to see YoY growth in Q2, however Q3 revenues shrank by 16% in Q3 as the result of a 4% decline in average fees and an 18% decline in average balances.
ETF lending revenues continue to underperform relative to 2018; Q3 revenues came in at $77m, a decline of 10% compared with Q3 2019. Borrow demand for exchange traded products remains robust, with Q3 balances 11% higher YoY. The decline in revenues is primarily the result of lower fees for the high-yield credit products. Reflecting the continued adoption trend for exchange traded products, both the AUM and total lendable assets reached new all-time high in Q3.
The general theme in fixed income was declining revenue largely as the result of declining fees, however balances for government bonds and corporates both declined YoY in Q3. Government bond lending revenues peaked in Q1 2018 at $470m before trending steadily downward through the first half of 2019. There were some opportunities to lend government bond specials, most notably the US 10Y and the CA 30Y. The major story in sovereign lending in Q3 was the spillover from repo funding markets, which saw the rebate for financing transactions in UST’s increase to 440bps on September 17th.
Corporate bond lending revenue fell 18% YoY, with Q3 revenues of $151m. The delta was almost entirely driven by a 17% decline in fees while average balances fell 1.6%. While the year over year comparison is harsh, revenues were little changed from the Q2 2019 total. Corporate bond lendable assets reached a new all-time high in Q3 ($2.3T), a 19% YoY increase.
Wrap-up
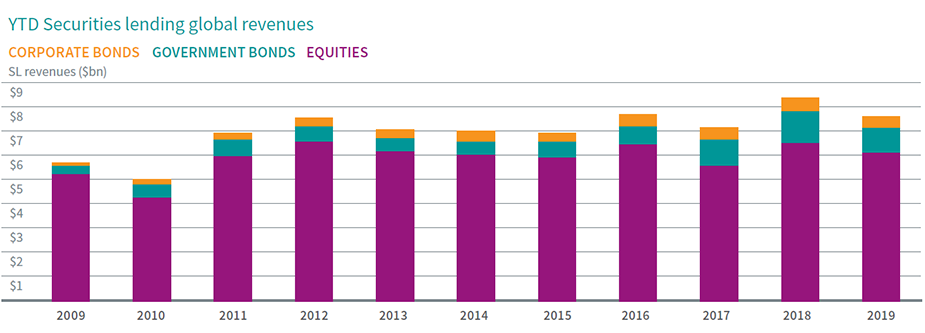
Revenues for Q3 saw some growth YoY, as the increase in equity revenues in North America were enough to offset declines in most other regions and asset classes. Revenues for the first half of 2019 declined 15% relative to first half of 2018, however H1 2018 was the best six-month span post-crisis. Through Q3, the YTD global securities lending revenues stand at $7.6bn, down 9% compared with the first three quarters of 2018.
The mix of revenue drivers has evolved in recent years. At the outset of 2018 fixed income was all-important. Government bond lending saw the highest post-crisis revenue in Q1 2018. Credit followed suit with Q2 2018 delivering the most return to lending corporate bonds on record. While fixed income was the headline in the early going of last year, EM equity loan balances were also increasing and reached an all-time peak in June 2018. The growth in EM demand led Q3 2018 to be the best quarter on record for Asia equity lending. Then came Q4 2018. The decline in global asset values put pressure on returns. Comparatively, in Q4 2015 and Q1 2016 an increase in equity short positioning and specials delivered outsized returns despite the sell-off. In that case, equity short sellers were badly burned in the latter portion of 2016, which may have caused some reticence in getting pressing shorts in Q4 2018.
The theme of Q3 was the return of specials balances in North America, while other regional equity and fixed income markets lagged historical returns. The supply of government bonds appears to have caught up to the demand for HQLA, which has continued to cool the revenue stream from lending those assets. The lofty returns for sovereign debt investors YTD have also hurt the borrow demand, as short bets on rates instruments have gone awry with the US Federal Reserve cutting rates. Through that lens, the steady demand for corporates is rather upbeat, despite the lower fees. Demand for hard to borrow emerging market equities has taken a step back, particularly in Asia. Those three former growth leaders for securities lending revenue, namely Asian equity, government bonds and corporate bonds, all took a backseat to the largest market by revenues, balances and lendable assets: US equities. The mid-teen percentage YoY revenue decline for the former growth asset classes were similar in Q3, however the decline in non-financing fees and balances for UST sticks out given the backdrop of rate cuts in the US. The surge in revenues from lending US Treasuries started with the first rate hike in 2015, suggesting that if the trend toward rate cutting remains in place, we may see a further downtrend in lending revenues for those securities. The decline in sovereign debt lending revenues may be structural, making the increase in North American equity specials revenue a most welcome offset.
{"items" : [
{"name":"share","enabled":true,"desc":"<strong>Share</strong>","mobdesc":"Share","options":[ {"name":"facebook","url":"https://www.facebook.com/sharer.php?u=http%3a%2f%2fstage.www.spglobal.com%2fmarketintelligence%2fen%2fmi%2fresearch-analysis%2fsecurities-lending-q3-update.html","enabled":true},{"name":"twitter","url":"https://twitter.com/intent/tweet?url=http%3a%2f%2fstage.www.spglobal.com%2fmarketintelligence%2fen%2fmi%2fresearch-analysis%2fsecurities-lending-q3-update.html&text=Securities+Lending+Q3+Update+%7c+S%26P+Global","enabled":true},{"name":"linkedin","url":"https://www.linkedin.com/sharing/share-offsite/?url=http%3a%2f%2fstage.www.spglobal.com%2fmarketintelligence%2fen%2fmi%2fresearch-analysis%2fsecurities-lending-q3-update.html","enabled":true},{"name":"email","url":"?subject=Securities Lending Q3 Update | S&P Global&body=http%3a%2f%2fstage.www.spglobal.com%2fmarketintelligence%2fen%2fmi%2fresearch-analysis%2fsecurities-lending-q3-update.html","enabled":true},{"name":"whatsapp","url":"https://api.whatsapp.com/send?text=Securities+Lending+Q3+Update+%7c+S%26P+Global http%3a%2f%2fstage.www.spglobal.com%2fmarketintelligence%2fen%2fmi%2fresearch-analysis%2fsecurities-lending-q3-update.html","enabled":true}]}, {"name":"rtt","enabled":true,"mobdesc":"Top"}
]}


