Customer Logins
Obtain the data you need to make the most informed decisions by accessing our extensive portfolio of information, analytics, and expertise. Sign in to the product or service center of your choice.
Customer Logins
BLOG
Aug 17, 2020
The anatomy of the great trade collapse of 2020
Key points:
- COVID-19 pandemic led to the most severe contraction of global trade on record
- The changes in trade are consistent with the time path of the pandemic and efforts of individual states to contain it
- In the analyzed group of 88 states responsible for the vast majority of global trade the value of exports went down by approximately 10% in the period January-April 2020 year-on-year
- The severity of the crises deepened in time and deteriorated significantly in March and April 2020, May 2020 will likely prove to be the worst month on record (and Q2 2020 in general for global trade relations)
- The impact of the crises is highly asymmetric in sectoral dimension with several sectors gaining (pharmaceuticals and certain foodstuffs) while exports of certain groups of key manufacturing commodities collapsing (e.g. transportation equipment and in particular automotive, mineral fuels, machines, electrical equipment, certain luxury goods)
- The time path of the crises differs between sectors - some show a gradual recovery, in some, the situation deteriorates in time (for instance clocks and watches, vehicles)
The depth of the trade collapse in Q1 2020
It is difficult to estimate the severity of the situation without any access to a reliable and up-to-date data source. Unfortunately, trade data is reported by individual states with a varied lag and with a different frequency (some report the data monthly, some only on an annual basis).
To illustrate the impact of the ongoing pandemic on global trade and the course of changes we have compiled the data for 88 countries that have already reported full data for the first four months of 2020 that are present in IHS Markit Global Trade Atlas. The reporters included in the present analysis account for the vast majority of global exports.
The value of global exports in the first four months of 2020 reported by the analyzed states amounted to five billion US dollars. It represents a 10% decrease in comparison to the preceding year.
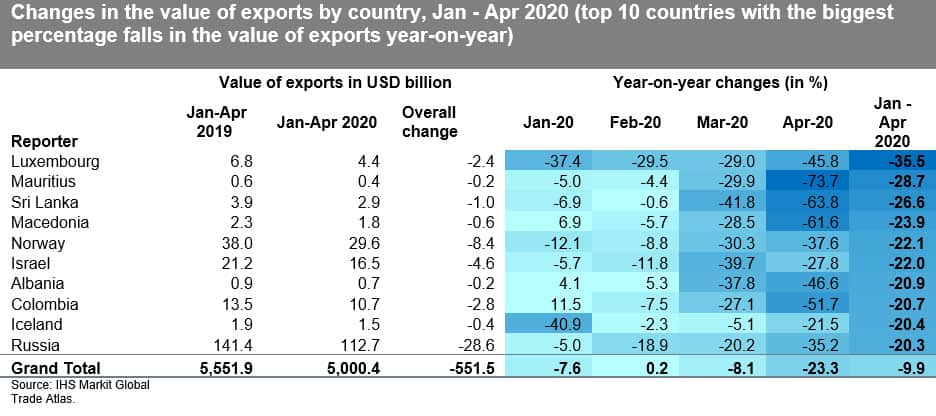
In January 2020 exports of 42 out of 88 analyzed reporters increased year-on-year. In 21 cases it went down by less than 5%. In the next ten states, it changed in a range from -5% to -10%. In 15 cases it went down by more than 10%. These include China mainland, Macau, Hong Kong SAR, Vietnam and Brazil.
41 out of 88 analyzed countries reported a year-on-year increase in exports in February 2020. This included China mainland (please note that China reported data jointly for January and February which was equally split by the IHS Markit Global Trade Atlas team). Overall exports increased by 0.2% globally year-on-year. In 26 cases the value of exports went down by less than 5%. In the next ten states, it changed in a range from -5% to -10%. In 11 cases it went down by more than 10%. These included Luxemburg, Russia, Finland, Ireland, Australia, and Israel. The situation in China was stabilizing and it seemed that the pandemic is under some control before it spread from South-West Asia first to Europe and other continents from March onwards (North America, South America, Africa, and so on).
In March 2020, the situation started to deteriorate. Overall exports went down by 8.8% year-on-year. Only 16 countries out of 88 recorded an increase in the value of exports. In 17 states the value of exports went down by less than 5%. In the next 15 states, it changed in a range from -5% to -10%. In 40 states it went down by more than 10% (including 14 with a decrease higher than by 20%). The list included the most affected European states for the first time: Italy, Spain, France, and the UK as well as other top economies: the US, Japan, and once again China mainland.
Unfortunately, the situation deteriorated further in Q2 2020. The data for April shows a decrease in the value of exports year-on-year in 81 out of 88 analyzed states. Overall decrease reached -23.3%. Only seven reported an increase. These include Cyprus, Hong Kong SAR, Panama, Thailand, China mainland, Ethiopia, and Ghana. In only two other states the value of exports went down by less than 5% year-on-year. In the next seven states, it changed in a range from -5% to -10%. In 71 states it went down by more than 10% (including 52 states with a decrease higher than by 20% and 20 states with the decrease by 40% and more). It is clear that April 2020 was the worst month so far and that the situation deteriorated globally on unprecedented scale and depth.
Taking the whole period January-April 2020 into account the value of exports increased in only 14 out of 88 analyzed states, which considering the situation, is exceptional. These include Panama, Pakistan, Brunei Darussalam, Ethiopia, and Kosovo. From the main advanced states, Ireland and Switzerland proved to be rather resilient. In 74 countries the value of exports decreased including all the top economies of the world. Overall exports collapsed by - 9.9% year on year. In 43 countries the decrease exceeded 10%. The worst affected states (with the decrease by 20% or more) include Luxembourg, Mauritius, Sri Lanka, Macedonia, Norway, Israel, Albania, Colombia, Iceland, Russia & Belize. The collapses has a global dimension affecting both advanced, emerging, and developing states at different levels of economic prosperity.
The impact on particular economies seems to depend on the severity of the pandemic in the individual countries and their top economic partners in particular in their specific region of location as well as on the particular composition or product structure of their economies and their embeddedness in the particular global value chains.
It seems that the full scale of the impact of the pandemic on global trade will be fully known only once the data becomes fully available for the second quarter of 2020. The quick analysis of IHS Markit PMI new export orders readouts for the manufacturing sector shows that the worst month on record was supposedly May 2020. We will provide the results as soon as they become available (the available results for the top ten economies seem to prove it with an exception for Brazil where the situation deteriorated further in June and July but affected mostly imports).

The sectoral asymmetry of the impact of the pandemic
From the very beginning, it was clear that the pandemic is likely to affect different sectors of the global economy to a varied extent and could positively boost exports of certain commodity groups due to increased demand. In order to identify this asymmetric impact, we have compiled the data using the HS2 classification of products. It is clear that the impact of the pandemic is highly asymmetric.
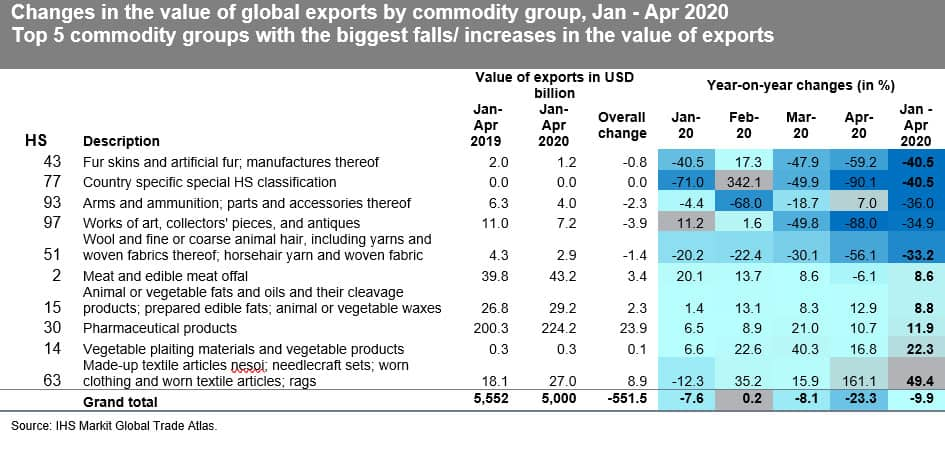
The value of exports of 22 commodity groups increased in the analyzed period year-on-year. This applies in particular to made-up textile articles, needlecraft sets, and worn clothing and worn textile articles (HS63), vegetable plaiting materials and vegetable products (HS14), pharmaceutical products (HS30), animal or vegetable fats and oils and their cleavage products (HS15), meat and edible meat offal (HS2) oil seeds and oleaginous fruits (HS12), edible fruit and nuts (HS8) and cereals (HS2). Apart from pharmaceuticals, which could be related to the response to the pandemic, these are basic food-related commodities.
On the other hand, global exports of 79 commodity groups decreased (in 59 cases by more than 10% and in 19 cases by more than 20%. The most adversely affected commodity groups include fur skins and artificial fur (HS43), arms and ammunition (HS93), works of art, collectors' pieces and antiques (HS97), wool, and fine or coarse animal hair (HS51). We also have representatives of all transportation equipment means including aircraft (HS88 - 24%), vehicles (HS87 - 23.5%), ships, boats and floating structures (HS89 - 22.6%) as well as railway or tramway locomotives, rolling stock (HS86 - 20.1%) in line with a significant decrease in demand for transport volumes. The list includes as well certain raw materials such as zinc (HS79) and tin (HS80), other types of skins and leather (HS41) and articles of leather (HS42), special woven fabrics (HS58) and silk (HS50) as well as clocks and watches (HS91) which could be indicative of lower demand for luxury goods in general and could reflect increased uncertainty of global consumers.
In value terms, the increase was most significant in the case of pharmaceuticals (by USD 23.9 billion) and the decreases exceeded 20 billion USD in the case of iron and steel (HS72, USD -20 billion), aircraft (HS88, USD -25.1 billion), electrical machinery and equipment (HS 85, USD -37.9 billion), nuclear reactors, boilers, machinery and mechanical appliances (HS 84, USD -77.7 billion), mineral fuels, mineral oils, and products of their distillation; (HS27, USD -88.2 billion) and vehicles (HS87, USD -111.9 billion). The list thus includes the most prominent manufacturing sectors with the most complex global value chains such as aerospace, automotive or machine industries and petrochemical industry key to the global economy. In general, the manufacturing sectors with the most elaborate value chains and the most defragment production proved to be the most prone to the pandemic The second group of most impacted commodities is the one dependent on the size of the global demand concerning the contraction in certain services sectors such as tourism or transportation and logistics. This is in line with general expectations though.
The time path of the crises differs between sectors - some show a gradual recovery, in some, the situation deteriorates in time (for instance clocks and watches, vehicles).

The background
The outbreak of COVID-19 proves to be the largest black-swan event in a century with a tremendous impact on the global economy. The nature of the black swan by definition makes them unpredictable and very harmful. Unless the situation improves significantly in the second part of the year, we are going to deal with the largest contraction of global trade since the Second World War and far greater than the effects of the global financial crisis in 2008-09 or other similar outbreaks (SARS, MERS, Ebola, etc.).
The reaction in global trade relations is consistent with the time path of the pandemic and steps taken by individual countries (or groups of countries) in controlling or mitigating it. Lockdowns and production stoppages adversely affected elaborated global value chains temporarily halting the production of many semi-finished and finished commodities. The long-term impacts of the crisis could be severe, with partial adjustments already taking place in terms of modifications in the global location of production and thus in trade flows due to changes in perceived risks by the business community. Uncertainty levels at the same time skyrocketed which was also fueled by the quickly deteriorating situation in the labor markets affecting negatively consumer confidence and impacting global demand. These unprecedented circumstances required fast reactions from the states.
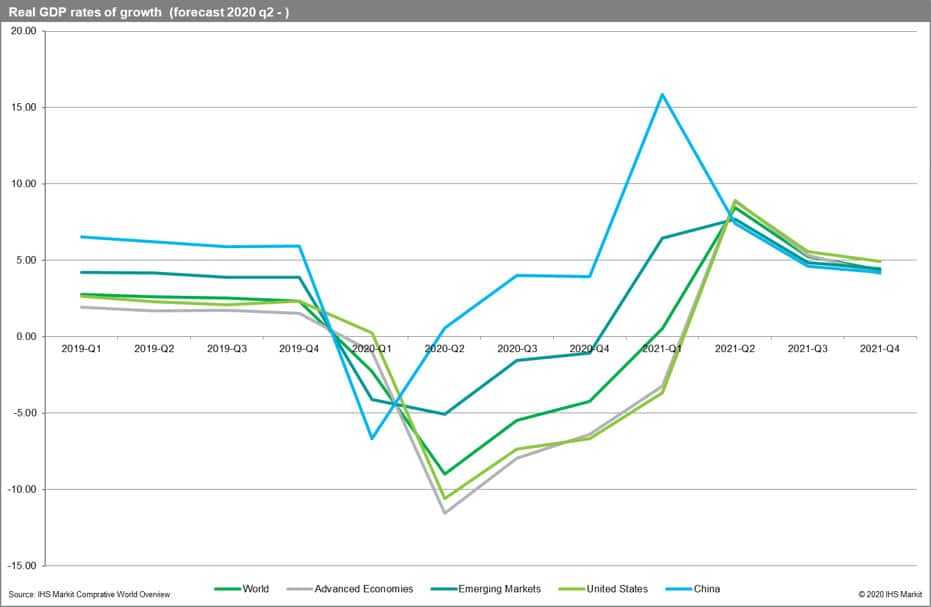
The unparalleled actions taken by governments have partially tempered the severity of the contraction, however, could not have fully mitigated it. Unfortunately, the pandemic is on-going and is likely to continue unless a successful vaccine is developed and implemented globally. The most recent Situation Report by the WHO (from 13 Aug 2020) states 20,439,814 cases globally since the beginning of January and 276,398 new infections. The impact of COVID-19 on global trade will depend on the duration, severity, and the spatial distribution of the pandemic. Unfortunately, the threat of the second wave of the pandemic is still increasing and it could have drastic consequences for the global economy postponing the expected recovery to next year (please refer to the most recent real GDP growth forecasts by IHS Markit).
It is evident, that the first country affected, China mainland is already recovering. However, globally, we are in a deep recession, with the key advanced economies such as the US particularly affected.

This column is based on data from IHS Markit Global Trade Atlas.
Full versions of the tables are provided to our subscribers on Connect. If you are interested, please contact IHS Markit customer care or your account manager for subscription package details.
For more details visit IHS Markit Global Trade Atlas
{"items" : [
{"name":"share","enabled":true,"desc":"<strong>Share</strong>","mobdesc":"Share","options":[ {"name":"facebook","url":"https://www.facebook.com/sharer.php?u=http%3a%2f%2fstage.www.spglobal.com%2fmarketintelligence%2fen%2fmi%2fresearch-analysis%2fthe-anatomy-of-the-great-trade-collapse-of-2020.html","enabled":true},{"name":"twitter","url":"https://twitter.com/intent/tweet?url=http%3a%2f%2fstage.www.spglobal.com%2fmarketintelligence%2fen%2fmi%2fresearch-analysis%2fthe-anatomy-of-the-great-trade-collapse-of-2020.html&text=The+anatomy+of+the+great+trade+collapse+of+2020+%7c+S%26P+Global+","enabled":true},{"name":"linkedin","url":"https://www.linkedin.com/sharing/share-offsite/?url=http%3a%2f%2fstage.www.spglobal.com%2fmarketintelligence%2fen%2fmi%2fresearch-analysis%2fthe-anatomy-of-the-great-trade-collapse-of-2020.html","enabled":true},{"name":"email","url":"?subject=The anatomy of the great trade collapse of 2020 | S&P Global &body=http%3a%2f%2fstage.www.spglobal.com%2fmarketintelligence%2fen%2fmi%2fresearch-analysis%2fthe-anatomy-of-the-great-trade-collapse-of-2020.html","enabled":true},{"name":"whatsapp","url":"https://api.whatsapp.com/send?text=The+anatomy+of+the+great+trade+collapse+of+2020+%7c+S%26P+Global+ http%3a%2f%2fstage.www.spglobal.com%2fmarketintelligence%2fen%2fmi%2fresearch-analysis%2fthe-anatomy-of-the-great-trade-collapse-of-2020.html","enabled":true}]}, {"name":"rtt","enabled":true,"mobdesc":"Top"}
]}


