Customer Logins
Obtain the data you need to make the most informed decisions by accessing our extensive portfolio of information, analytics, and expertise. Sign in to the product or service center of your choice.
Customer Logins
BLOG
Sep 07, 2020
Top 10 economies: Q2 2020 the worst quarter on record in trade with first signs of a sustained but very gradual upturn
Key points:
- Q2 of 2020 was the worst quarter on record for global trade and this is highly likely to apply to 2020 as a whole; on average May was the worst month so far among all the top 10 economies, even worse than April 2020
- June 2020 brought about an improvement in May 2020: all top economies apart from China are however still reporting negative growth rates in exports year-on-year ranging from -4.3% for Brazil to -26.1% for Japan
- In comparison to May the situation improves in all states apart from Japan, with the largest turn around reported for Canada, South Korea, United States, UK, Russia, and Brazil; July 2020 data reported for some of the states show a continuation in upturn
- China is thus the only top economy showing clear signs of recovery in Q2 2020 - Chinese exports were higher by 0.3% in June and 7.2% higher in July year-on-year
- The tendencies observed in export data at the end of Q2 and beginning of Q3 2020 are in line with observations made by the Maritime & Trade team based on high-frequency shipment data in recent weeks
- Manufacturing PMI new exports orders readouts by IHS Markit for August 2020 are above of 50.0 points for EU, Russia, and China, and values close to 50.0 points for India, UK, South Korea, and Japan; the lowest level has been recorded for Japan; it implies a further improvement in exports soon unless the double-hit scenario materializes
- The trend in the PMI is clear and consistent within Q2 of 2020 showing a gradual improvement in market confidence from May onwards and continuing in Q3 which allows for more optimism for the third quarter of 2020
Developments in Q2 and Q3
- The COVID-19 pandemic has triggered a severe economic recession; the first two quarters of 2020 brought about a collapse in trade (year-on-year) due to the spread of the pandemic and resulting lockdowns and production stoppages and disruption in global value chains
- The contraction in the trade that started in China and East Asia in Q1 and spread globally continued well into Q2 with most countries reporting massive declines with April/May being the worst months on record; the situation is slowly improving far from a recovery though
- Most of the top 10 economies have by now reported data for June or even July 2020 apart from India and the EU
- Without any doubt, Q2 of 2020 was the worst quarter on record for global trade and this is very likely to apply to 2020 as a whole; on average May was the worst month so far among all the top 10 economies, even worse than April 2020
- The worst affected country is India which reported a massive drop of 60.5% in the real value of exports in April 2020 year-on-year with some improvement in May
- Year-on-year changes in exports in May 2020 were negative for all reporting states including China (-3.3%), Brazil (-14.5%), South Korea (-23.8%), Japan (-26.0%), EU external trade (-31.6%) Russia (-34.8%), UK (-35.0%), India (-35.7%), United States (-36.3%), and Canada (-40.9%)
- June 2020 brought about an improvement on May 2020 for all reporting states apart from Japan; year-on-year China reported an increase in exports of 0.3%, all others are reporting negative growth rates year-on-year ranging from -4.3% for Brazil to -26.1% for Japan; in comparison to May the situation improves in all states apart from Japan, with the largest turn around reported for Canada, South Korea, United States, UK, Russia, and Brazil
- July 2020 data reported for some of the states show a continuation in upturn - with exports growing year-on-year in China (+7.2%) and lower reported year-on-year decreases in the value of exports for Brazil (-2.9%), South Korea (-7.1%), and Japan (-17.9%); out of South East Asian economies Japan seems to be most adversely affected by COVID-19 - at least at this stage of the crises
- China is thus the only top economy showing clear signs of recovery in Q2 2020 - Chinese exports were higher by 0.3% in June and 7.2% higher in July year-on-year
- The tendencies observed in export data at the end of Q2 and beginning of Q3 2020 are in line with observations made by the Maritime & Trade team based on high-frequency shipment data in recent weeks
- Year-on-year changes in imports in June 2020 were negative for all reporting states apart from China (an increase of 3.3% year-on-year) and ranged from -4.6% for Russia and -8.8% in the UK to -16.4% in Canada and -19.8% in Brazil
- EU and India have only reported data for May, and they show a massive drop of -52.4% for India and -27.7% for the EU's external imports
- Among the countries that reported the trade data for July (the first month of Q3) the year-on-year changes in the value of imports are negative for all the states and range from -4.2% for China, -11.6% for South Korea, -21.1% for Japan to -35.2% for Brazil and interestingly after an improvement reported in June, the situation worsened in July
- The situation in exports looks more positive than in imports among the top 10;this could imply weak import demand due to lower consumer confidence and higher overall uncertainty levels with some clients postponing their purchases or substituting foreign goods with domestic alternatives; on the other hand, it could also imply a gradual increase in exports to markets outside top 10 economies which were to a lesser extent adversely affected by the COVID-19 pandemic an, in particular, emerging and developing economies
- The negative tendencies observed in imports in July can undermine prospects for broader recovery weakening prospects for further improvements in exports in the forthcoming months taking into account that approximately 3/4 of the global trade is done within the group of the top 10 economies

Prospects for the forthcoming months
- As has been already stressed in prior commentaries the reaction in trade so-far is consistent with the escalating global COVID-19 pandemic and steps taken by individual countries/territories in controlling or mitigating it
- On 30 August 2020 WHO reported 24,854,140 cases globally and 838,924 deaths so far; the number of new cases reported globally daily close to 255,000 and close to the peak observed at the beginning of August; the cumulative number of cases is the largest for the region of the Americas (53%) followed by Europe (17%) and South-East Asia (16%) with the largest number of new cases reported in recent weeks in South America; on a country level, the worst affected states in gross terms are the US, Brazil, India, Russia, Peru, Colombia, Mexico, Spain, Argentina, UK, Iran & Saudi Arabia
- The impact on global trade and global economy will depend on the duration, severity, and the spatial distribution of the pandemic, with several scenarios still possible, and critically depends on the development and implementation of a successful potential vaccine
- The threat of the so-called second wave of the pandemic is increasing with some states having already re-imposed strict overall or partial (regional) while some states are still unable to deal efficiently with the first wave
- The potential second wave in autumn 2020 could have drastic consequences for the global economy postponing the expected recovery to the later month of Q2 or even Q3 of the next year
- Some economist have already pointed to a potential change in the shape of the crisis from the V to W pattern with OECD speaking of additional decline on top of the existing one in the double-hit scenario, having the same likelihood as the single-hit scenario
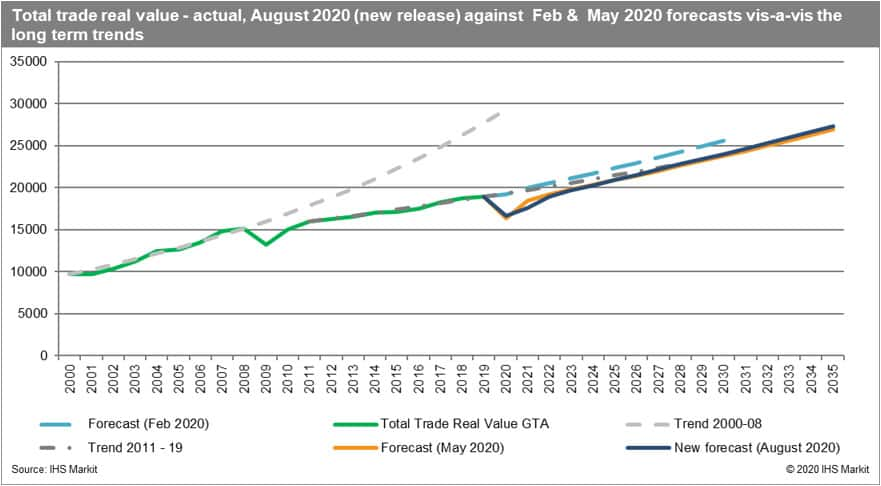
- The recent release of the IHS Markit GTA Forecasting model of global trade has accommodated the most recent trade data and the new macro forecasts and it points to a weakened and more gradual recovery more of U-shape (looking from a yearly perspective) with better prospects in the long-run than in our May release but not returning to the pre-COVID trend
- Our estimated contraction in global trade value for the entire year is close to the results reported by the OECD and IMF and close to the estimated optimistic scenario of the WTO from April 2020

- Themanufacturing PMI new exports orders readouts (unadjusted) by IHS Markit for August 2020 are above of 50.0 points for EU, Russia, and China,and values close to 50.0 points for India, UK, South Korea, and Japan; the lowest level has been recorded for Japan; it implies a further improvement in exports unless the double-hit scenario materializes
- The trend in the PMI is clear and consistent within Q2 of 2020 showing a gradual improvement in market confidence from May onwards and continuing in Q3 which allows for more optimism for the third quarter of 2020

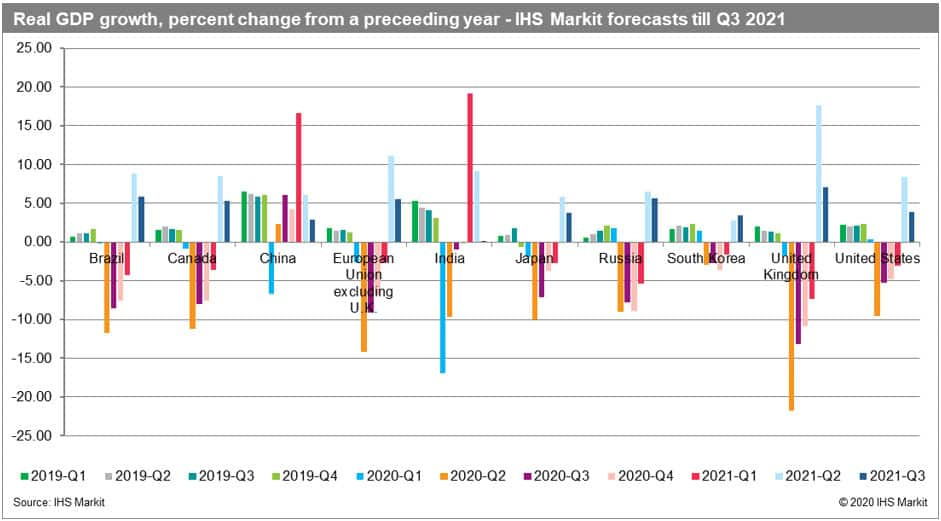
- The most recent real GDP growth forecasts from IHS Markit Comparative World Overview (published on 21 August 2020) point to a recession in most of the states throughout 2020 and Q1 of 2021, apart from China (recovery already in Q2 2020) and India (recovery in Q1 2021 - a delay by half a year in comparison to the prior release).The worst affected countries (regions) in Q3 2020 are forecasted to be the UK (-13.1% year-on-year), EU (-9.1%), Brazil (-8.5%), and Canada (-8.1%); China at the same time is forecasted to grow year-on-year by 6.0%
- Stronger recovery in real GDP growth rates is expected only later in 2021 with the peak in Q2 2021; the forecast, unfortunately, depends critically on the ability to deal with the potential waves of the pandemic and thus uncertainty levels are still high; this is consistent with the incoming trade data and is driving our trade forecasts.

This column is based on data from Maritime & Trade Global Trade Atlas and GTA Forecasting data as well as other resources of IHS Markit.
{"items" : [
{"name":"share","enabled":true,"desc":"<strong>Share</strong>","mobdesc":"Share","options":[ {"name":"facebook","url":"https://www.facebook.com/sharer.php?u=http%3a%2f%2fstage.www.spglobal.com%2fmarketintelligence%2fen%2fmi%2fresearch-analysis%2ftop-10-economies-q2-2020-the-worst-quarter-on-record-in-trade.html","enabled":true},{"name":"twitter","url":"https://twitter.com/intent/tweet?url=http%3a%2f%2fstage.www.spglobal.com%2fmarketintelligence%2fen%2fmi%2fresearch-analysis%2ftop-10-economies-q2-2020-the-worst-quarter-on-record-in-trade.html&text=Top+10+economies%3a+Q2+2020+the+worst+quarter+on+record+in+trade+with+first+signs+of+a+sustained+but+very+gradual+upturn+%7c+S%26P+Global+","enabled":true},{"name":"linkedin","url":"https://www.linkedin.com/sharing/share-offsite/?url=http%3a%2f%2fstage.www.spglobal.com%2fmarketintelligence%2fen%2fmi%2fresearch-analysis%2ftop-10-economies-q2-2020-the-worst-quarter-on-record-in-trade.html","enabled":true},{"name":"email","url":"?subject=Top 10 economies: Q2 2020 the worst quarter on record in trade with first signs of a sustained but very gradual upturn | S&P Global &body=http%3a%2f%2fstage.www.spglobal.com%2fmarketintelligence%2fen%2fmi%2fresearch-analysis%2ftop-10-economies-q2-2020-the-worst-quarter-on-record-in-trade.html","enabled":true},{"name":"whatsapp","url":"https://api.whatsapp.com/send?text=Top+10+economies%3a+Q2+2020+the+worst+quarter+on+record+in+trade+with+first+signs+of+a+sustained+but+very+gradual+upturn+%7c+S%26P+Global+ http%3a%2f%2fstage.www.spglobal.com%2fmarketintelligence%2fen%2fmi%2fresearch-analysis%2ftop-10-economies-q2-2020-the-worst-quarter-on-record-in-trade.html","enabled":true}]}, {"name":"rtt","enabled":true,"mobdesc":"Top"}
]}


