Customer Logins
Obtain the data you need to make the most informed decisions by accessing our extensive portfolio of information, analytics, and expertise. Sign in to the product or service center of your choice.
Customer Logins
ECONOMICS COMMENTARY
Nov 17, 2020
Tracking Monthly Chinese Economic Performance
- Monthly GDP tracker helps to better understand cyclical economic developments in China
- GDP tracker reinforce usefulness of monthly Caixin Composite PMI data
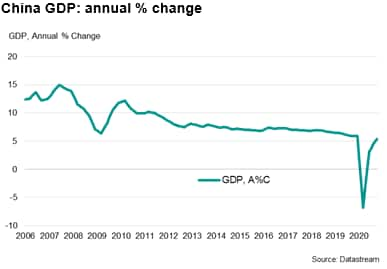
Prior to the global pandemic, China's GDP growth figures exhibited a noticeable degree of stability, with underlying growth tending to ease in a gentle and broadly predictable pattern over the decade leading up to the start of 2020.
In contrast, higher frequency indicators - such as the Caixin China Composite PMI (compiled by IHS Markit) and, for that matter, many official data statistics - have described more typical cyclical changes in economic activity, for example indicating slowdowns in growth in 2015 and 2018.
With little cyclicality apparent in the official headline GDP growth statistics, in response - and as a means of providing timelier and higher frequency estimates of changes in GDP - there is a growing literature on alternative ways to track economic performance in China. Two such approaches have been undertaken by the San Francisco Federal Reserve Bank and the New York Federal Reserve Bank.
In this short note we closely follow the spirit of this recent work and construct our own benchmark indicator to track Chinese economic growth. Taking the common component from 12 high frequency indicators that all provide insight on Chinese economic developments, we create a useful benchmark to corroborate not just our own PMI survey data, but to better understand on a monthly basis cyclical trends in official Chinese data.
An alternative GDP growth indicator
There has been a notable development during recent years in the scope and range of economic indicators available for China. From these available data sources, we pick 12 that appear particularly useful in tracking economic activity. These include indicators of electricity production, industrial production, household consumption, freight traffic, trade and investment*. Note that the PMI survey data have been excluded as one of the intentions is to compare the performance of the new indicator against our own PMI, and to thereby create an time series against which PMI data can be more accurately benchmarked than GDP.
To create our high frequency alternative indicator of Chinese economic activity, we first need to disentangle the two principal forces that act on growth: longer-term structural trend changes and shorter-term cyclical developments.
This reflects the observation that China has grown and developed at a startling pace over the past 30 years or so but, as the economy undergoes a transition from being driven by high and rapid increases in capital investment to being primarily driven by consumption, growth rates have trended gently downwards. Indeed, double digit annual growth rates seen in the early 2000s have now given way - prior to the current COVID-19 pandemic - to gains typically in the region of 6-7%. However, this long-term trend can mask shorter-term changes in the business cycle, which tend to dominate our interest when understanding near-term economic developments.
We therefore first focus on extracting the cyclical component from our individual data series, by effectively removing the long-term trend in the data. We do this by transforming our individual data series into year-on-year growth rates (except consumer confidence, which we use annual level differences), before a process of detrending via a five-year centred moving average filter.
We then normalise all data series such that each series shows a broadly similar magnitude of volatility, and then finally derive an initial indicator of economic activity by extracting the common cyclical component from our 12-time series. This is achieved through the technique of principal component analysis.
*The full list of indicators relates to exports, industrial production, electricity production, retail sales, fixed asset investment, real estate investment, consumer confidence, civil aviation passenger numbers, rail passenger numbers, freight traffic volume, auto sales and floor space under construction.
Monthly GDP growth
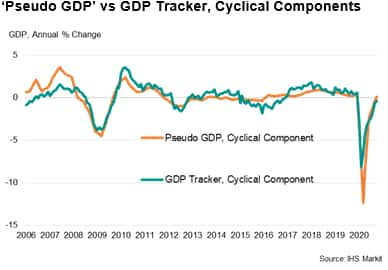
To translate our derived monthly indicator into comparable annual GDP growth rates we have also constructed a 'pseudo' monthly GDP series from the official quarterly GDP data. Using interpolation techniques to estimate a monthly time-series from the quarterly GDP figures, this series is also detrended and the cyclical component extracted.
Linking this series to the first principal component of our high frequency indicators through linear regression provides us a new series of year-on-year growth estimates based on the set of alternative indicators. The results are charted below.
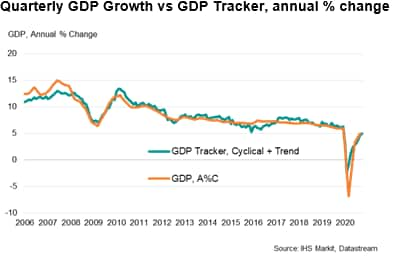
Finally, we can re-establish the linkage with the official quarterly GDP data by adding back in the long-term trend component to the GDP tracker. This is highlighted in the chart below.
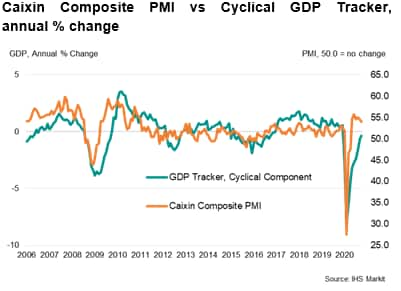
From the two preceding charts we can see that China has indeed likely experienced some cyclicality in GDP growth relative to that indicated by the official GDP series. For instance, slower gains in economic output were seen during 2015, before a growth upturn occurred in 2016/2017. A further slowdown was again seen in 2018. These cycles broadly correspond with those signalled by the monthly PMI data (see chart below).
Whilst not directly comparable with each other - PMIs tend to measure underlying changes in activity as opposed to the year-on-year growth rates indicated by the GDP tracker, which is why the PMI figures sometimes have a noticeable lead - the positive relationship between the cyclical component of GDP and the Caixin Composite PMI reinforces the usefulness of the business survey data in understanding short-term economic developments.
October data
The latest mass release of official data confirms that the Chinese economy continued its recovery during October, led by gains in industrial production, retail and investment.
Taking the latest signal from the monthly data shows that the economy was growing at a year-on-year rate of just below 5.0% during October, signalling a positive start to the fourth quarter of 2020 - albeit one below pre-pandemic trends as the recovery in consumption continued to lag that seen in industry.
Recent PMI data have shown that growth, following a strong recovery from the aftermath of the lockdowns related to COVID-19 earlier in the year, has recently steadied - albeit at elevated levels which were last seen during 2011.
Expect official GDP growth to continue its recent trajectory into year-end before settling around a rate broadly equivalent to those seen before the pandemic.
Paul Smith, Economics Director, IHS Markit
Tel: +44 1491 461038
paul.smith@ihsmarkit.com
© 2020, IHS Markit Inc. All rights reserved. Reproduction in whole or in part without permission is prohibited.
Purchasing Managers' Index™ (PMI™) data are compiled by IHS Markit for more than 40 economies worldwide. The monthly data are derived from surveys of senior executives at private sector companies, and are available only via subscription. The PMI dataset features a headline number, which indicates the overall health of an economy, and sub-indices, which provide insights into other key economic drivers such as GDP, inflation, exports, capacity utilization, employment and inventories. The PMI data are used by financial and corporate professionals to better understand where economies and markets are headed, and to uncover opportunities.
This article was published by S&P Global Market Intelligence and not by S&P Global Ratings, which is a separately managed division of S&P Global.
{"items" : [
{"name":"share","enabled":true,"desc":"<strong>Share</strong>","mobdesc":"Share","options":[ {"name":"facebook","url":"https://www.facebook.com/sharer.php?u=http%3a%2f%2fstage.www.spglobal.com%2fmarketintelligence%2fen%2fmi%2fresearch-analysis%2ftracking-monthly-chinese-economic-performance-nov2020.html","enabled":true},{"name":"twitter","url":"https://twitter.com/intent/tweet?url=http%3a%2f%2fstage.www.spglobal.com%2fmarketintelligence%2fen%2fmi%2fresearch-analysis%2ftracking-monthly-chinese-economic-performance-nov2020.html&text=Tracking+Monthly+Chinese+Economic+Performance+%7c+S%26P+Global+","enabled":true},{"name":"linkedin","url":"https://www.linkedin.com/sharing/share-offsite/?url=http%3a%2f%2fstage.www.spglobal.com%2fmarketintelligence%2fen%2fmi%2fresearch-analysis%2ftracking-monthly-chinese-economic-performance-nov2020.html","enabled":true},{"name":"email","url":"?subject=Tracking Monthly Chinese Economic Performance | S&P Global &body=http%3a%2f%2fstage.www.spglobal.com%2fmarketintelligence%2fen%2fmi%2fresearch-analysis%2ftracking-monthly-chinese-economic-performance-nov2020.html","enabled":true},{"name":"whatsapp","url":"https://api.whatsapp.com/send?text=Tracking+Monthly+Chinese+Economic+Performance+%7c+S%26P+Global+ http%3a%2f%2fstage.www.spglobal.com%2fmarketintelligence%2fen%2fmi%2fresearch-analysis%2ftracking-monthly-chinese-economic-performance-nov2020.html","enabled":true}]}, {"name":"rtt","enabled":true,"mobdesc":"Top"}
]}


