Customer Logins
Obtain the data you need to make the most informed decisions by accessing our extensive portfolio of information, analytics, and expertise. Sign in to the product or service center of your choice.
Customer Logins
BLOG
Jul 07, 2020
Tracking trade in COVID-19 medical supplies
Trade in 1Q 2020
International trade in crucial COVID related medical supplies touched $188 billion during 1Q20, registering a growth of 12% over the same period last year even as total trade declined due to lockdowns in several reporting countries.
IHS Markit has developed a trade dashboard developed to track the medical commodities involved in the COVID-19 supply chain. The dashboard currently tracks 39 medical commodities at HS-6 level (Figure 1) which have been mapped to overall commodity groups ranging from medical protective clothing, to testing kits. The list of products may evolve in response as new treatments (like vaccines) emerge and as data consistency for certain commodities like HS 6309790 for face masks get established or in response to new demands on the trade.
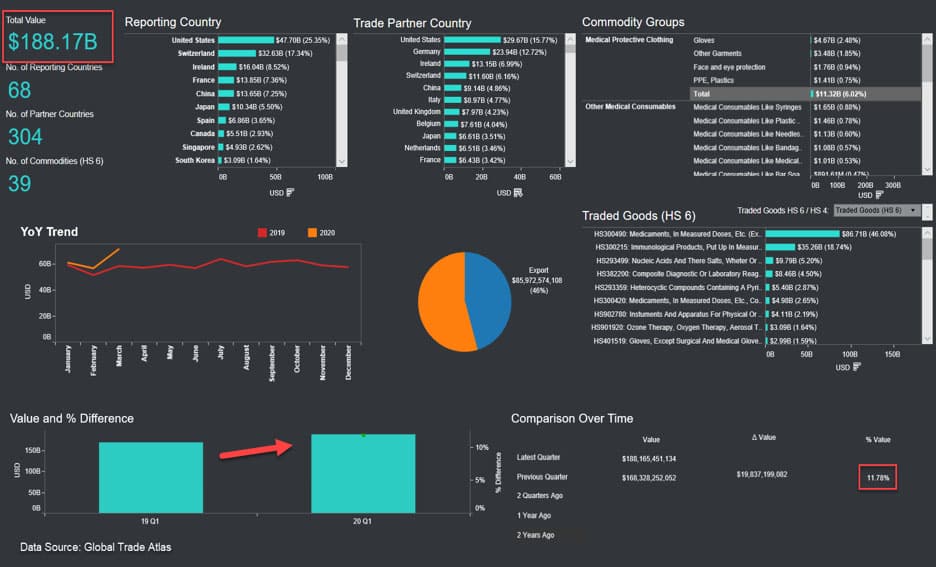
Figure 1: COVID-19 medical supplies dashboard. Source: IHS Markit Global Trade Atlas
Trade-in these critical medical supplies picked up pace in March as countries began to prioritize customs clearance, simplified imports of relief goods to fight the pandemic. Increasingly air cargo was used to expedite these shipments to counter cutbacks in scheduled airlines and the consequent loss of belly-hold cargo capacity.
During 1Q trade (exports and imports) in all the major categories grew by double digits (Figure 2). The exemption were consumables and protective clothing categories which were likely impacted by export bans in several countries.
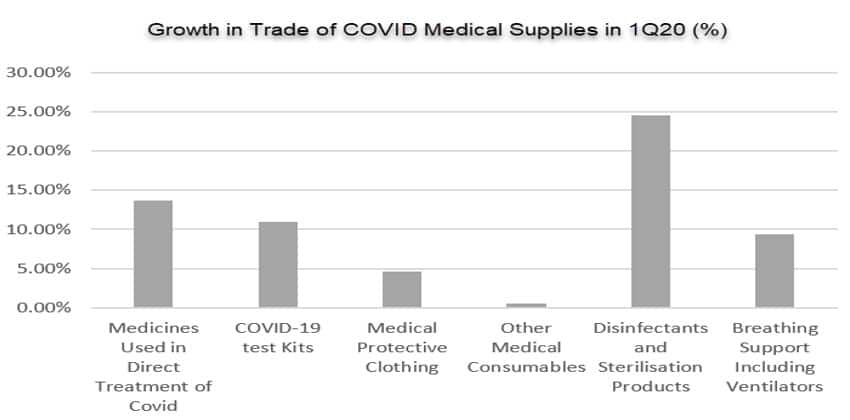
Figure 2: Growth in trade of COVID-19 medical supplies. Source: IHS Markit Global Trade Atlas
The data is from Global Trade Atlas that compiles official import and export statistics from sources around the world into a comprehensive database of merchandise trade. Around 30 countries are excluded because they haven't reported trade data for the full quarter. A separate tab on the dashboard allows the inclusion or exclusion of these countries.
Global trade over the same period declined 32% while trade in pharmaceuticals declined 28% due to supply chains disruptions with several countries imposing shutdowns, curfews and other restrictions to prevent the spread of COVID-19.
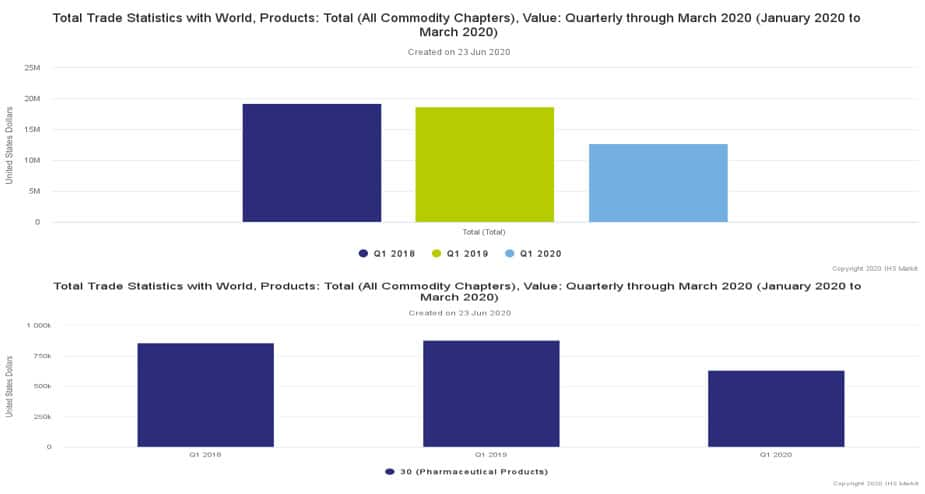
Figure 3: Total trade Q1 year-on-year comparison. Source: IHS Markit Global Trade Atlas
Trade in the essential COVID medical supplies among the top exporters and importers is highly inter-dependent. The Sankey chart from the dashboard illustrates the deep relationships among the top exporters and importers and helps track the subtle shifts among them.
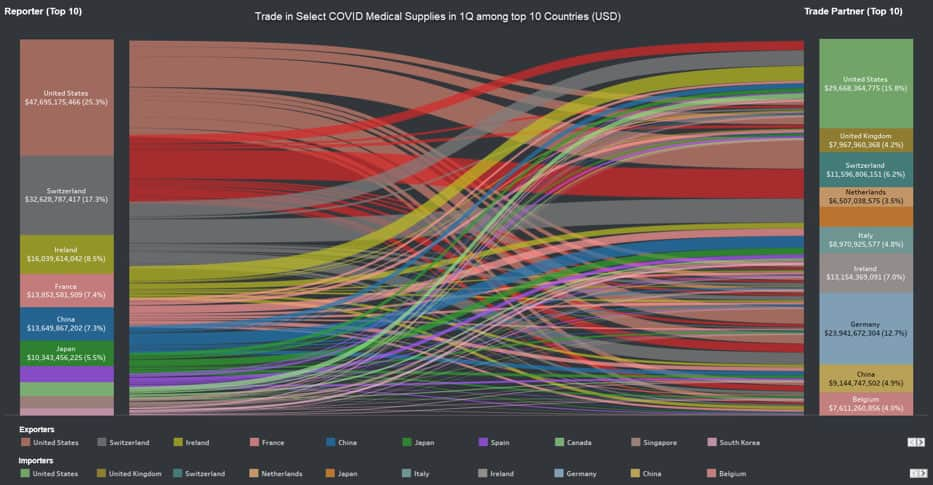
Figure 4: Sankey chart highlighting COVID supply dependencies. Source: IHS Markit Global Trade Atlas
Market Shares
The top ten countries dominate over 80% of trade in the share of COVID medical supplies. Some of these countries have a significant share in specific segments. For instance, Switzerland dominates exports of medications and testing kits while China dominates medical protective clothing and consumables segments. The U.S. tops share of imports in all sectors excepts for disinfectants and sterilization products where it is a significant exporter.
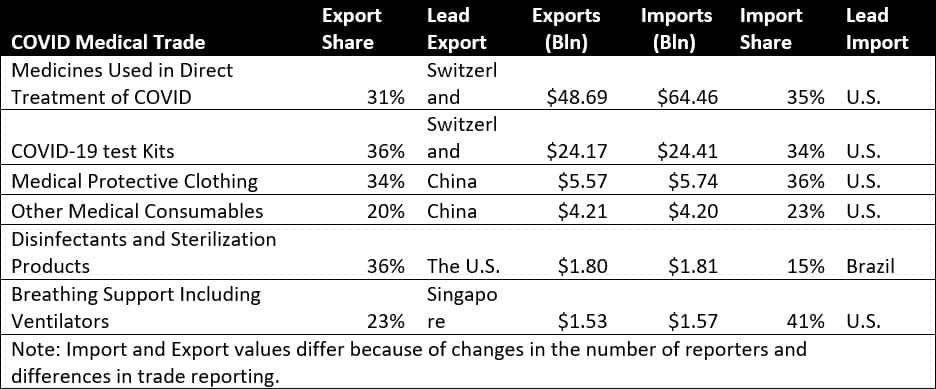
Figure 5: Supply market share. Source: IHS Markit Global Trade Atlas
Country Profiles
The US is also by far the biggest market and accounts for a quarter of the value of total trade among the 68 countries tracked. Overall, imports accounted for 72% of the entire business in 1Q. Its largest trade partners for medical supplies are mainly European like Switzerland and Ireland though in categories like medical protective garments the sourcing partners are primarily from Asia.
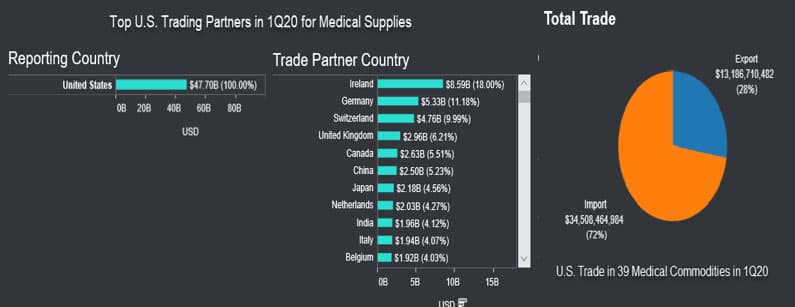
Figure 6: US imports of medical supplies. Source: IHS Markit Global Trade Atlas
US imports of medical supplies tracked grew 22% by value in 1Q, with all categories except medical protective clothing posting increases. Exports barely grew with disinfectants and medical protective garments being the major sectors to show significant growth.

Figure 7: US growth of medical supplies. Source: IHS Markit Global Trade Atlas
China ranks fifth by total trade in the list of medical commodities tracked. During 1Q, its imports grew 12% while exports fell 4.5% over the same period last year even as the pandemic originated first in the country during January.
There has been a shift in trade pattern as the COVID outbreak got contained in China. Initially, during the outbreak of the pandemic in January, China stepped up imports of medical protective garments. Imports peaked in March after which China started exporting to other countries.
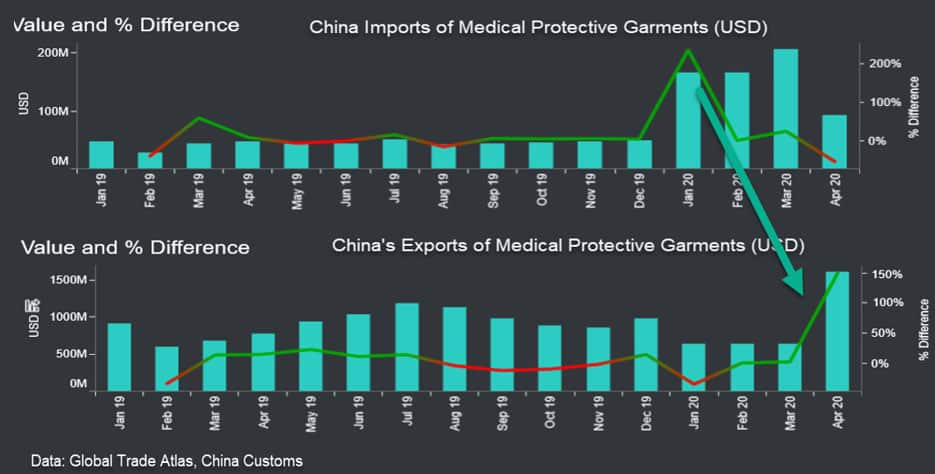
Figure 8: China trade of medical supplies. Source: IHS Markit Global Trade Atlas
Among the overall basket of goods tracked, exports of personal protective clothing made up 37% of exports from the country. China customs reports export values as free onboard while it classifies imports to include cost, insurance and freight. The decline in exports has impacted negatively on China's market share during 1Q. Together, China and Malaysia account for more than half the export share market in the medical protective clothing category in 1Q. China's share of direct exports has declined from 40% to 34% from the previous quarter with other countries picking up market shares.
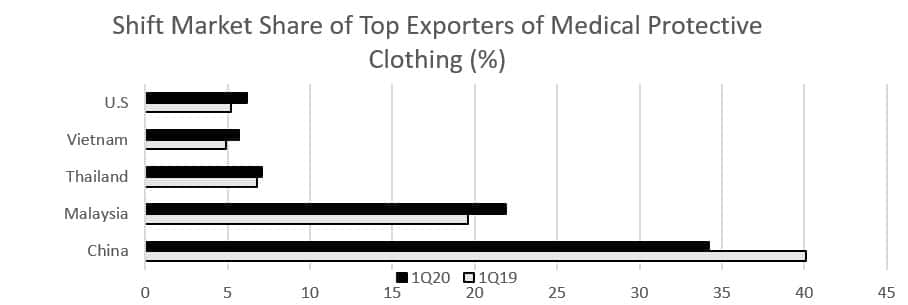
Figure 9: Market share change. Source: IHS Markit Global Trade Atlas
Tests for COVID consist of the antibody or antigen testing, which can only detect coronavirus once the patient is infected for at least ten days. The PCR test tries to find genetic sequences of the virus by deploying primers - chemicals or reagents, which are added to test if a reaction occurs - that attach to the targeted genetic sequences.
Like medical protective clothing, Chinese exports of COVID testing kits and supplies started peaking from February and account for 11% of the value of trade among exports of medical goods exports. Exports ramped up in March as the pandemic in China came under control. China is among the countries that have reported data for April. About 20% of the exports by value were through Hong Kong, during January-April and are likely to have been re-exported. Hong Kong imports from China not only for inward processing but also serves as a re-distribution hub.
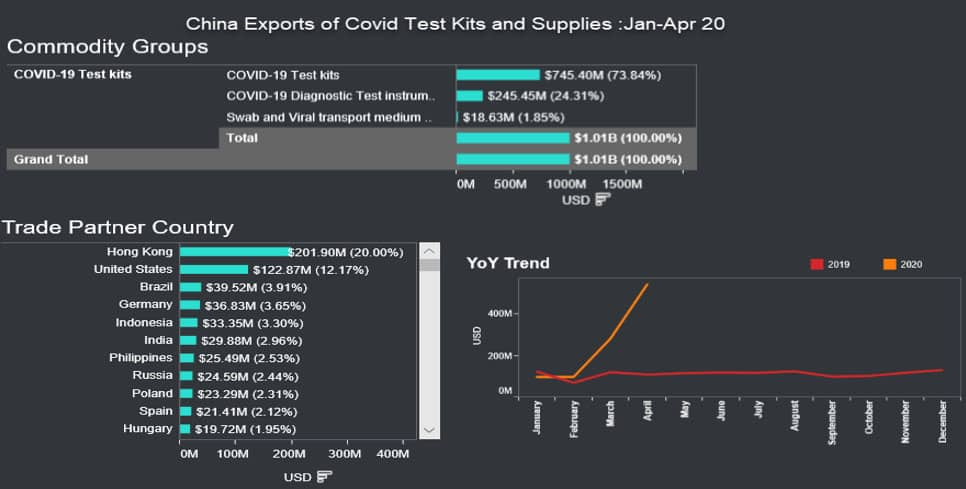
Figure 10: China's exports of medical supplies. Source: IHS Markit Global Trade Atlas
Key Product Exports
Exports of medications surged by 14% during 1Q to touch $113 Bln as the coronavirus pandemic prompts worldwide stockpiling of medicines. The pandemic has driven up demand for intensive care and emergency-use drugs. Medications, including anti-infectives for direct treatment of COVID accounted for the largest share (60%) by value in the basket of 39 medical supplies tracked. Major exporters Switzerland, Ireland, US and France, make up 72% of total trade by value during 1Q and leading importers being US and Germany.
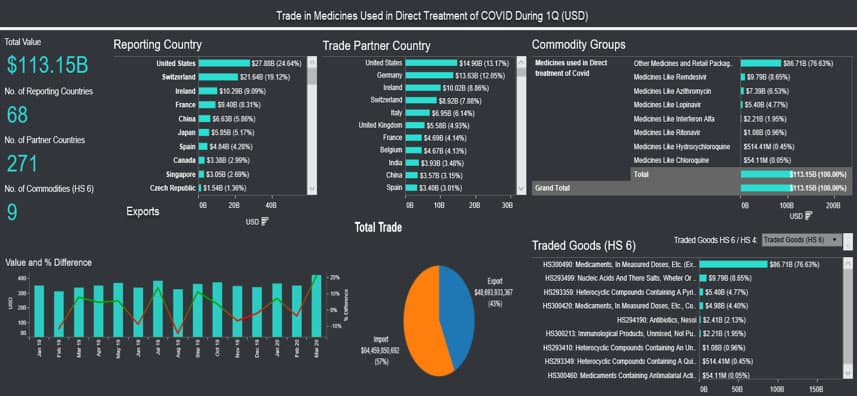
Figure 11: Global trade of medical supplies. Source: IHS Markit Global Trade Atlas
Asia dominates exports of personal protective clothing. Exports by value grew by 3% to touch $5.57 billion, even as restrictions on trade crimped trade. Several countries like Indonesia, Malaysia, Vietnam, Thailand and South Korea announced temporary export bans on personal protective equipment (PPE) like masks and gloves to counter internal shortages in the fight against COVID-19 pandemic. The data excludes major items like HS 6309790 (under face masks) as we examine the consistency of the commodities under this classification and likely to be added in the next iteration.
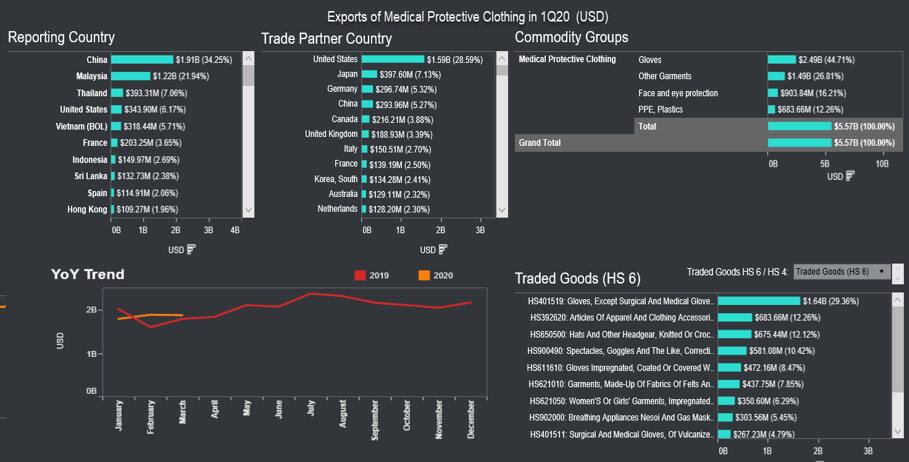
Figure 12: Global exports of medical supplies. Source: IHS Markit Global Trade Atlas
Exports of COVID test kits and supplies with 26% share in the pie for medical supplies rose by 7% during the quarter, spiking 60% in March as countries like China ramped up its exports.
Switzerland - the leading exporter of test kits - exported the most to the US, Germany and China during the 1Q. These countries are also significant exporters of test kits. Exports to the US tops in value while Germany imported more kits by units, implying a higher unit value realization from shipments to the US.

Figure 13: Swiss exports of medical supplies. Source: IHS Markit Global Trade Atlas

Figure 14: Swiss exports of medical supplies. Source: IHS Markit Global Trade Atlas
Subscribe to our monthly newsletter and stay up-to-date with our latest analytics
{"items" : [
{"name":"share","enabled":true,"desc":"<strong>Share</strong>","mobdesc":"Share","options":[ {"name":"facebook","url":"https://www.facebook.com/sharer.php?u=http%3a%2f%2fstage.www.spglobal.com%2fmarketintelligence%2fen%2fmi%2fresearch-analysis%2ftracking-trade-in-covid19-medical-supplies.html","enabled":true},{"name":"twitter","url":"https://twitter.com/intent/tweet?url=http%3a%2f%2fstage.www.spglobal.com%2fmarketintelligence%2fen%2fmi%2fresearch-analysis%2ftracking-trade-in-covid19-medical-supplies.html&text=Tracking+trade+in+COVID-19+medical+supplies+%7c+S%26P+Global+","enabled":true},{"name":"linkedin","url":"https://www.linkedin.com/sharing/share-offsite/?url=http%3a%2f%2fstage.www.spglobal.com%2fmarketintelligence%2fen%2fmi%2fresearch-analysis%2ftracking-trade-in-covid19-medical-supplies.html","enabled":true},{"name":"email","url":"?subject=Tracking trade in COVID-19 medical supplies | S&P Global &body=http%3a%2f%2fstage.www.spglobal.com%2fmarketintelligence%2fen%2fmi%2fresearch-analysis%2ftracking-trade-in-covid19-medical-supplies.html","enabled":true},{"name":"whatsapp","url":"https://api.whatsapp.com/send?text=Tracking+trade+in+COVID-19+medical+supplies+%7c+S%26P+Global+ http%3a%2f%2fstage.www.spglobal.com%2fmarketintelligence%2fen%2fmi%2fresearch-analysis%2ftracking-trade-in-covid19-medical-supplies.html","enabled":true}]}, {"name":"rtt","enabled":true,"mobdesc":"Top"}
]}


