Customer Logins
Obtain the data you need to make the most informed decisions by accessing our extensive portfolio of information, analytics, and expertise. Sign in to the product or service center of your choice.
Customer Logins
BLOG
Mar 11, 2020
Trade analysis: Sluggish 2019, major shake-up in Q1 and endangered recovery in Q2 2020
Key Points:
- The y/y changes in trade data for four out of the main nine economies of the world show that 2019 was a difficult year with sluggish growth and contraction; potential recovery has been destroyed by the outbreak COVID19
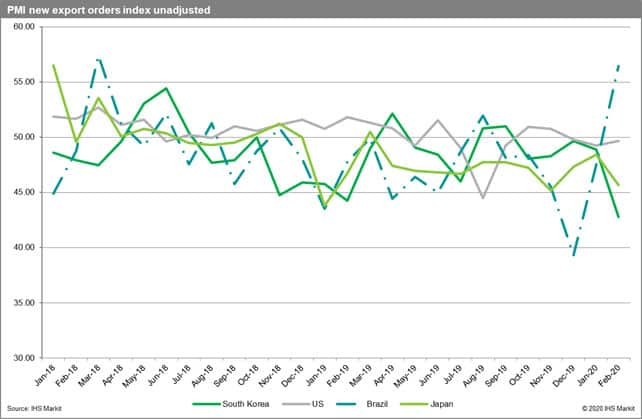
- The manufacturing PMI new orders index in February 2020 was pointing to contraction for South Korea and Japan (apart from China and Italy the worst affected countries so far), was close to 50.0 for the US and pointing to growth for Brazil
- The increase in the number of cases confirmed could change the market sentiment for these as well
- The newest trade forecasts from IHS Markit GTA Forecasting (February release) point to an increase in total global trade volume to 14,465 million metric tons in 2020 and 14,997 million metric tons in 2021. The estimates for 2020 and 2021 are significantly lower in comparison to the previous release and growth rates predicted are now equal to 1.7% and 3.7% (in comparison to 2.7% and 5.0% forecasted previously)
- The real value of global trade is expected to grow to USD 19,403 billion in 2020 and USD 20, 139 billion in 2021. In other words, we expect to increase by 1.5% in 2020 and 3.8% in 2021
- Our forecasts can be cut further with the inclusion of the new incoming data; prospects for a global recovery in Q2 are diminishing fast
- The prospects for global trade and the global economy in 2020 are unfortunately turning. Hopefully, the worst affected and the source of the outbreak in Q1 2020, China, will be the first one to bring it under control and boost regional and global recovery in Q3 & Q4
Introduction
Out of the main nine economies of the world - the US, China (mainland), EU27, the UK, Japan, South Korea, India, Brazil, and Russia only four countries the US, Japan, South Korea and Brazil currently has trade data available for the first months of 2020. This can be accessed via IHS Markit Global Trade Atlas.
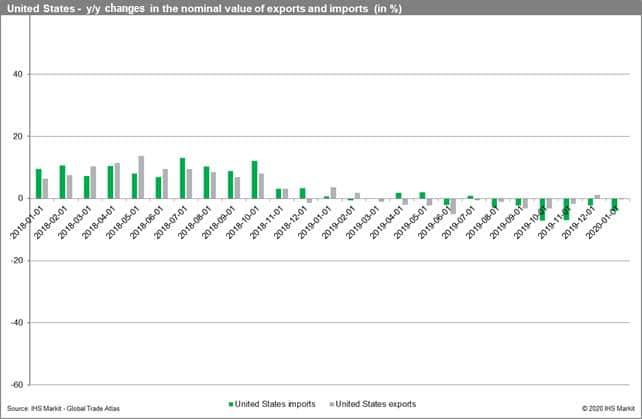
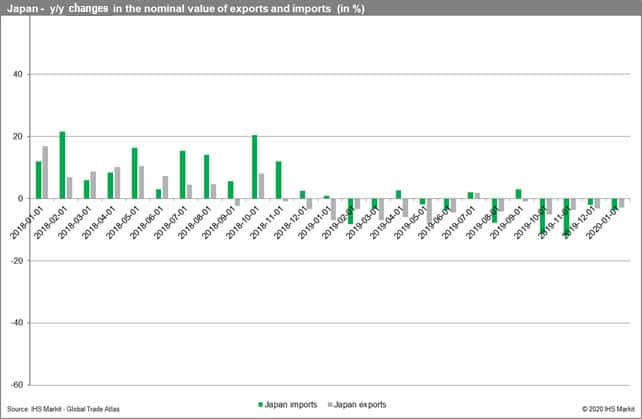
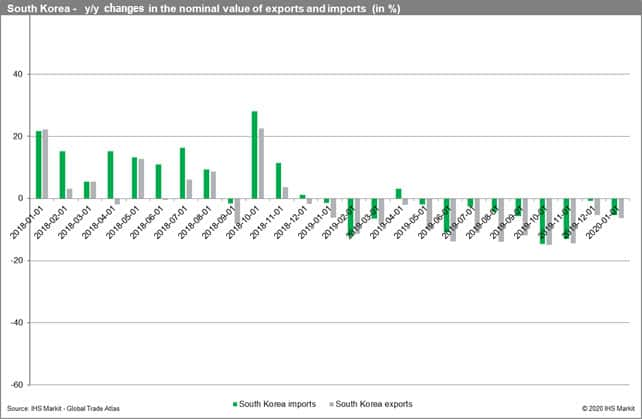
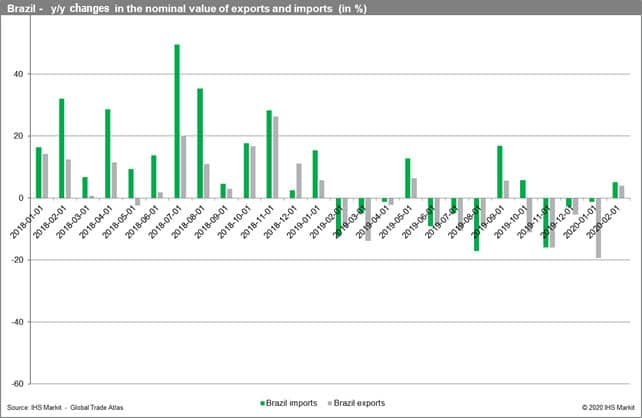
In the following charts, we show the year-on-year changes in the nominal value of exports and imports of the countries on a monthly basis from January 2018. The most recent data is available for Brazil and includes February 2020. For the remaining three we have data for January 2020. The data is not very promising. The optimism visible in 2018 has disappeared.
Trade in 2019
In comparison to the preceding 12 months, 2019 was rather sluggish. The third and fourth-quarter results for the US and Japan showed adverse changes y/y. It was much worse for South Korea in 2019 which proved to be very difficult with y/y falls thought the year. The situation was much more dynamic for Brazil with y/y increases in exports reported in May and September. The last three months of the year proved to be difficult. The manufacturing PMI new export orders (unadjusted) index by IHS Markit was below the benchmark value of 50.0 for all the analyzed states with the lowest level for Brazil but showing an improvement in December. It is a very good predictor of forthcoming changes in trade.
Trade in 2020
Both exports and imports decreased in nominal value y/y in January 2020 apart from the US. The situation was poor for Japan but even worse for South Korea. Brazilian exports collapsed y/y in January which was predicted by the PMI in November of the preceding year. US imports decreased quite significantly y/y while US exports behaved rather well - the fall y/y was small.
The PMI values reacted differently to the outbreak of the COVID19 - the biggest black swan so far of 2020 potentially leading to a global crises (very probable looking from the current perspective - as of 9 March 2020 according to the WHO 109,577 confirmed cases, 3,809 deaths and 104 affected; a fall in stock markets by 15 - 30% on the main markets within a month, outages in production, major disturbances to global value and logistics chains, collapse in global tourism, transport flows). The US PMI new export orders were close to the 50.0 in January 2020, the Brazilian was above of 55.0 which explains an increase in both exports and imports in trade data in February 2020, while it fell for Japan and fell even worse for South Korea. We should thus observe a y/y fall in exports and imports for the two countries in the forthcoming months. The PMI for the US and Brazil is only going to accommodate the inflow of new negative information on the pandemic escalation of COVID19 in months to come.
Prospects for global trade in 2020
The newest trade forecasts from IHS Markit GTA Forecasting (February release) point to an increase in total global trade volume to 14,465 million metric tons in 2020 and 14,997 million metric tons in 2021. The estimates for 2020 and 2021 are significantly lower in comparison to the previous release and growth rates predicted are now equal to 1.7% and 3.7% (in comparison to 2.7% and 5.0% forecasted previously). The real value of global trade is expected to grow to USD 19,403 billion in 2020 and USD 20,139 billion in 2021. In other words, we expect to increase by 1.5% in 2020 and 3.8% in 2021. The forecasts could be cut further with the inclusion of the new data. The prospects for global trade and the global economy in 2020 are unfortunately turning. Hopefully, the worst affected and the source of the outbreak in Q1 2020 China will be the first one to bring it under control and boost regional and global recovery in Q3 & Q4.
This column is based on data from Global Trade Atlas from IHS Markit and its other resources including the PMI.
{"items" : [
{"name":"share","enabled":true,"desc":"<strong>Share</strong>","mobdesc":"Share","options":[ {"name":"facebook","url":"https://www.facebook.com/sharer.php?u=http%3a%2f%2fstage.www.spglobal.com%2fmarketintelligence%2fen%2fmi%2fresearch-analysis%2ftrade-analysis-sluggish-2019-major-shakeup-in-q1.html","enabled":true},{"name":"twitter","url":"https://twitter.com/intent/tweet?url=http%3a%2f%2fstage.www.spglobal.com%2fmarketintelligence%2fen%2fmi%2fresearch-analysis%2ftrade-analysis-sluggish-2019-major-shakeup-in-q1.html&text=Trade+analysis%3a+Sluggish+2019%2c+major+shake-up+in+Q1+and+endangered+recovery+in+Q2+2020++%7c+S%26P+Global+","enabled":true},{"name":"linkedin","url":"https://www.linkedin.com/sharing/share-offsite/?url=http%3a%2f%2fstage.www.spglobal.com%2fmarketintelligence%2fen%2fmi%2fresearch-analysis%2ftrade-analysis-sluggish-2019-major-shakeup-in-q1.html","enabled":true},{"name":"email","url":"?subject=Trade analysis: Sluggish 2019, major shake-up in Q1 and endangered recovery in Q2 2020 | S&P Global &body=http%3a%2f%2fstage.www.spglobal.com%2fmarketintelligence%2fen%2fmi%2fresearch-analysis%2ftrade-analysis-sluggish-2019-major-shakeup-in-q1.html","enabled":true},{"name":"whatsapp","url":"https://api.whatsapp.com/send?text=Trade+analysis%3a+Sluggish+2019%2c+major+shake-up+in+Q1+and+endangered+recovery+in+Q2+2020++%7c+S%26P+Global+ http%3a%2f%2fstage.www.spglobal.com%2fmarketintelligence%2fen%2fmi%2fresearch-analysis%2ftrade-analysis-sluggish-2019-major-shakeup-in-q1.html","enabled":true}]}, {"name":"rtt","enabled":true,"mobdesc":"Top"}
]}


