Customer Logins
Obtain the data you need to make the most informed decisions by accessing our extensive portfolio of information, analytics, and expertise. Sign in to the product or service center of your choice.
Customer Logins
BLOG
Dec 02, 2019
Global Trade Insight: US Imports from China in the wake of the trade war
Author: Tomasz Brodzicki, Ph.D., Senior Economist II, IHS Markit Maritime & Trade
Key points:
- In 2018 China was responsible for 21.3 percent of total US imports in nominal value (539.6 billion USD). The CAGR for the period of 2005 - 2018 for the series was equal to 6.3 percent
- The volume of US imports from China in 2018 amounted to 75.2 million tonnes and increased by 6.8 percent yoy despite the outset of a trade war
- The share of maritime transport in servicing US imports from China is showing an upward trend
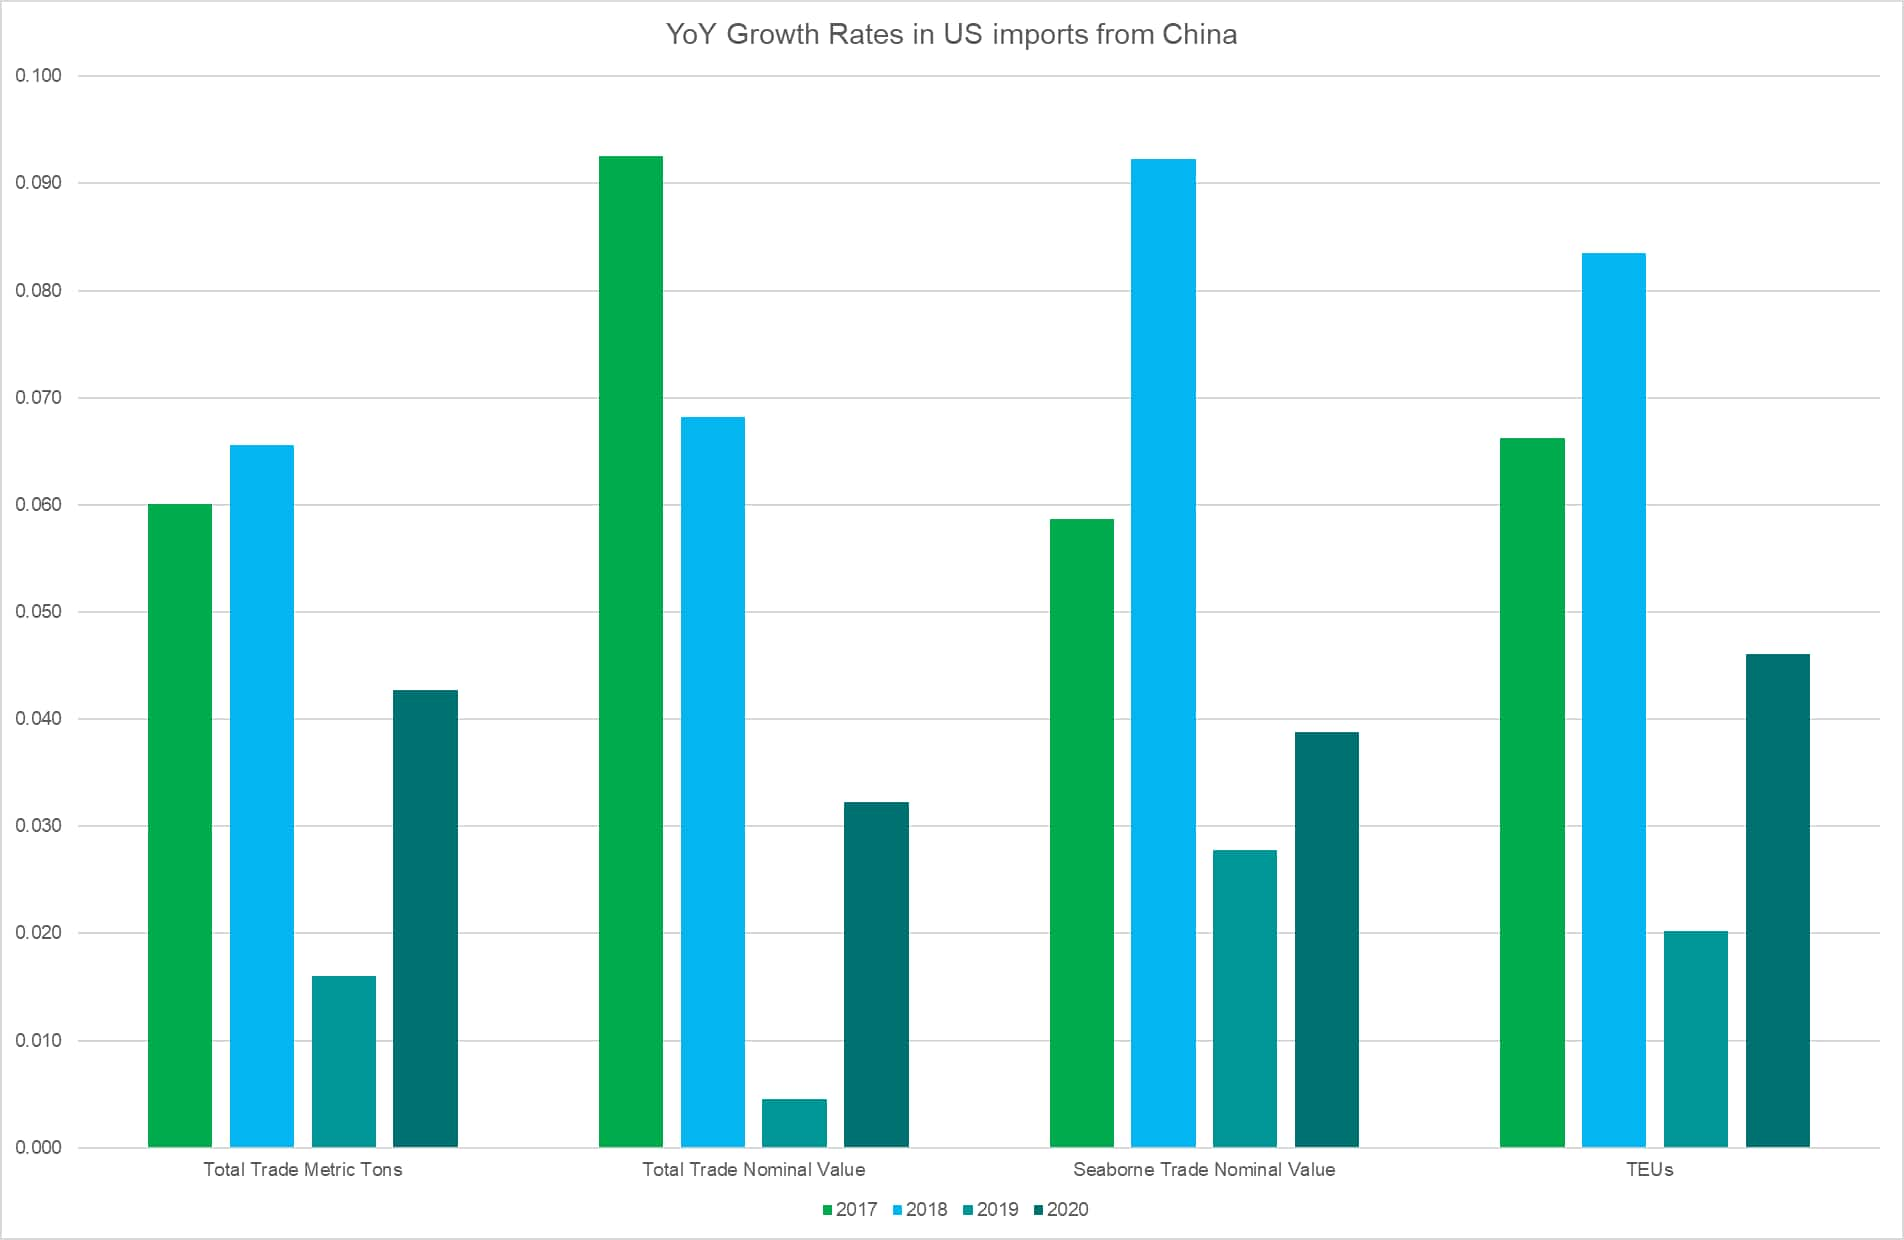
- The containerized US imports from China in 2018 reached approx. 11 million TEUs. The volume is predicted to grow by 2.0 percent in 2019 and 4.6 percent in 2020
- Over the long run (2005-2018) we observe a clear decrease of Pacific-based terminals in servicing US imports from China in favor of Atlantic based terminals (on the South Atlantic Coast in particular)
The volume and nominal value of US imports from China
US imports from China in 2017 reached over 70.5 million tonnes and exceeded 75.2 million tonnes in 2018. We predict lower growth rates in 2019 and 2020 - respectively 1.6 and 4.3 percent. The forecasted CAGR for the period 2019 - 2030 is 4.1 percent.
The nominal value of imports reached 505 billion USD in 2017 and increased to 539.7 billion USD in 2018. It is forecasted to reach 559.6 billion USD in 2020. The forecasted CAGR for the nominal value of US imports from China for the period 2019 - 2030 is 3.7 percent (lower than trade volume).
The seaborne trade amounted to 343.2 billion USD in 2017 and 374.9 billion USD in 2018. We forecast it to grow by 2.8 percent in 2019 and 3.9 percent in 2020 (it is supposed to exceed 400 billion USD in value). The share of seaborne trade in US imports from China was 77.0 percent in 2005 and then decreased. In recent years the share shows an upward trend increasing from 67.9 percent in 2017 and is predicted to go up to 71.5 percent in 2020.


** 2019 & 2020 Forecasted Values
This column is based on data from IHS Markit Global Trade Atlas (GTA) and GTA Forecasting.
{"items" : [
{"name":"share","enabled":true,"desc":"<strong>Share</strong>","mobdesc":"Share","options":[ {"name":"facebook","url":"https://www.facebook.com/sharer.php?u=http%3a%2f%2fstage.www.spglobal.com%2fmarketintelligence%2fen%2fmi%2fresearch-analysis%2fus-imports-from-china-in-the-wake-of-the-trade-war.html","enabled":true},{"name":"twitter","url":"https://twitter.com/intent/tweet?url=http%3a%2f%2fstage.www.spglobal.com%2fmarketintelligence%2fen%2fmi%2fresearch-analysis%2fus-imports-from-china-in-the-wake-of-the-trade-war.html&text=Global+Trade+Insight%3a+US+Imports+from+China+in+the+wake+of+the+trade+war+%7c+S%26P+Global+","enabled":true},{"name":"linkedin","url":"https://www.linkedin.com/sharing/share-offsite/?url=http%3a%2f%2fstage.www.spglobal.com%2fmarketintelligence%2fen%2fmi%2fresearch-analysis%2fus-imports-from-china-in-the-wake-of-the-trade-war.html","enabled":true},{"name":"email","url":"?subject=Global Trade Insight: US Imports from China in the wake of the trade war | S&P Global &body=http%3a%2f%2fstage.www.spglobal.com%2fmarketintelligence%2fen%2fmi%2fresearch-analysis%2fus-imports-from-china-in-the-wake-of-the-trade-war.html","enabled":true},{"name":"whatsapp","url":"https://api.whatsapp.com/send?text=Global+Trade+Insight%3a+US+Imports+from+China+in+the+wake+of+the+trade+war+%7c+S%26P+Global+ http%3a%2f%2fstage.www.spglobal.com%2fmarketintelligence%2fen%2fmi%2fresearch-analysis%2fus-imports-from-china-in-the-wake-of-the-trade-war.html","enabled":true}]}, {"name":"rtt","enabled":true,"mobdesc":"Top"}
]}


