Customer Logins
Obtain the data you need to make the most informed decisions by accessing our extensive portfolio of information, analytics, and expertise. Sign in to the product or service center of your choice.
Customer Logins
ECONOMICS COMMENTARY
Nov 29, 2024
Using the Global PMI instead of GDP as a macro indicator for investing
PMI survey data offer investors an indicator of economic growth conditions which is historically more highly correlated with equity market prices than widely-used GDP data. Moreover, the PMI is available months before GDP data, and is not subject to revision. We also show how the PMI data can also be easily converted into GDP-equivalent growth rate, or 'nowcast', providing investors with an accessible substitute for GDP in their models and analysis.
Global economic growth and equities
The monitoring of global macroeconomic conditions forms an important aspect of investing. At the most fundamental level, companies generally make more profits in times of economic growth than in downturns, so knowing when the pace of economic expansion is accelerating is generally seen as a useful indication for moving investment funds into equities. Similarly, downturns either send signals to reduce exposure to equities or to hedge against the declines. Investor relation teams often consequently also use economic growth indicators to steer investor guidance on likely corporate performance.
Larger, multinational, companies will not only have their financial performance dictated by national economic growth trends, but must also consider the broader global economic environment.
To monitor macro conditions, the most widely used indicator of economic growth is gross domestic product, or GDP. GDP is the total sum of all output from an economy, which by definition should also equate to the total expenditure and income within an economy, once factors such as international trade and taxes are taken into consideration.
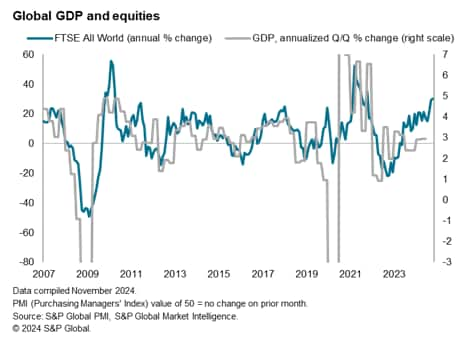
Hence GDP tends to correlate with equity prices. As shown below, the quarterly change in global GDP, which is compiled by summing all available national GDP data, showed a similar trend over time with changes in global equity prices, as tracked by the FTSE All World Index.
However, the fit is by no means perfect: the two series in fact exhibit a correlation of just 46% when GDP is compared to the three-month on-three-month change in equities, and only 31% when compared with the annual percent change in equities, as measured from 2007 to 2024.
The disadvantages of GDP to investors
Some of this poor correlation reflects the different coverage of GDP and the equity universe. While equity prices reflect corporate performance, GDP includes coverage of government departments, which typically account for around a third of all economic activity. GDP can also be hugely influenced by one-off factors such as dramatic changes in energy, mining or agricultural output (often weather related). As such, the signal from GDP relating to pure business performance across an investment universe such as the equity market can at times be misleading for investors.
Separating out government spending from business activity in the GDP data is possible in theory, which would help improve the signal to equity markets form GDP, but is more complicated in practice. This is especially difficult as such detail is often only available well after the first estimates of GDP are published. To elaborate, we must consider how GDP data tend to be published in different 'vintages'. First, initial estimates for each quarter are published as soon as possible to allow an early insight into the overall growth trend. These estimates are provisional, based on only partial data (often based largely on information from just the first two months of the quarter). These early estimates are followed by more detailed estimates when more data become available to government statisticians. It is often only in these subsequent releases that the breakdown of various aspects of GDP, such as consumer spending, business investment and government spending, becomes available. In Europe, it can in fact be several months after each quarter when these detailed GDP data are published.
A further consideration is that the additional, more accurate, detailed information available in the subsequent GDP releases often leads statisticians to revise their initial estimates of GDP. Many economies, for example, struggled to accurately track the post-pandemic recoveries, often understating growth, as was the case in the United States, Canada, and the United Kingdom. For the latter, the Financial Times considered "How the UK's radical data revisions shattered its economic narrative" of post-COVID recovery.
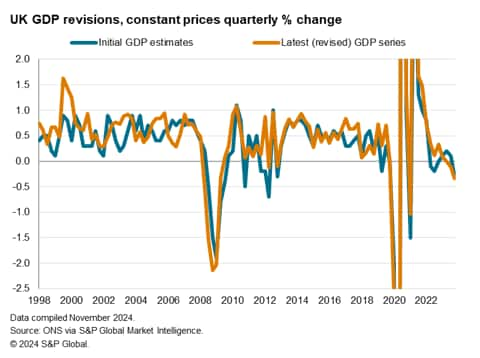
However, it must be borne in mind that even the revision-prone early GDP estimates are only published with a delay each quarter, such that any estimates of GDP in fact lag global equity prices by several months. Consider, for example, that economic growth conditions in the January of any given year will not be generally signalled by GDP data until at least April, when the first quarter GDP estimates start appearing.
When we consider that these early estimates can be subject to sometimes major revision, the value of GDP to investors as a signal of changing economic growth momentum is brought into question.
Finally, an additional concern is that GDP data are producing using different methodologies around the world. For example, early estimates of GDP in the United States are derived from data relating to spending by households, business and government, while data in Europe tend to be calculated initially from estimates of output. Not only do these methodological differences make international comparisons difficult, but they add to the problems of analysing the detail within the GDP numbers, especially for example when trying to split out business performance from government spending.
In short, GDP data suffer various disadvantages to investors:
- By encompassing government spending, and other aspects of the economy not relevant to pure business conditions, GDP can send misleading signals of corporate performance.
- GDP data are usually only published quarterly, with even the first estimates of GDP released with a delay.
- Initial estimates of GDP tend to be revised, sometimes significantly.
- Methodological differences make it difficult to accurately compare performance between countries and aggregate international GDP data, especially when seeking to analyse the detail behind the headline numbers.
Getting ahead of the (GDP) curve
Financial market participants who are able get ahead of the curve, by changing their exposure to equities before GDP data are released, can therefore enjoy an advantage on other investors. This advantage is further enhanced if cleaner signals of actual business conditions can be obtained compared to the blurred or misleading signals often sent by GDP data.
A widely used alternative to GDP is the Purchasing Managers' Index, or PMI, business surveys compiled by S&P Global.
The PMI data are derived from monthly surveys of business executives in over 30,000 companies around the world, encompassing all major developed and emerging economies.
The PMI data offer several advantages over GDP data to investors wanting to track macroeconomic conditions:
- PMI data cover business conditions across manufacturing and private sector services, purposefully excluding the public sector to provide clearer signals on changing corporate performance to equity analysts.
- PMI data are published monthly, released at the start of each month to provide the earliest indications of business conditions in each prior month.
- After release at the start of each month, PMI data are not subsequently revised (with the exception of some minor re-estimation of seasonal influences from time to time).
- PMI data are calculated using the same methodology in each country, enabling easy aggregation and comparison of PMI data internationally, and allowing easy sub-sector analysis of the data.
More accurate tracking of equity performance
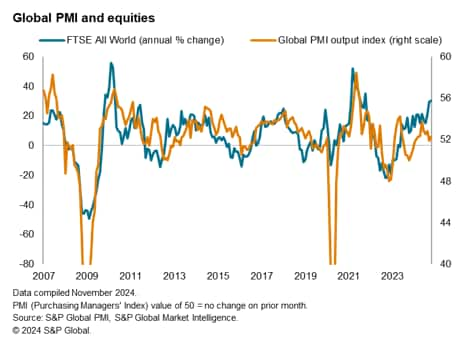
The exclusion of public sector activities partially helps explain why the PMI survey's global output index exhibits a higher correlation with global equity prices than GDP.
When compared with the three-month-on-three-month percent change in the FTSE All World Index, the PMI exhibits a correlation of 57% compared to the comparable 46% correlation seen for GDP. This rises to 58% if the PMI leads the FTSE All World Index by one month, further underscoring the value of the PMI as a superior timely indicator for equity prices.
When compared with the annual percent change in the FTSE All World Index, the PMI exhibits a correlation of 65% compared to the 31% correlation seen for GDP. This holds at 60% if the PMI leads the FTSE All World Index by one month, once again further underscoring the value of the PMI as a superior timely indicator for equity prices.
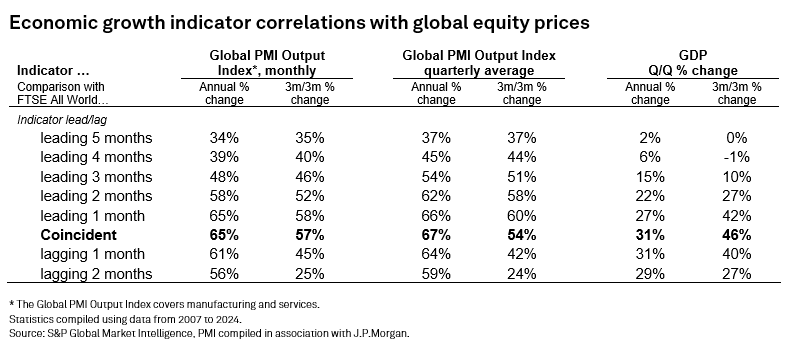
Note also that the correlation of the global PMI with FTSE All World Index also rises further if an average value of the PMI is used for each calendar quarter, which also represents a more accurate like-for-like comparison of performance vis-a-vis quarterly GDP. The quarterly average of the PMI shows a 67% correlation with the annual percent change in equity prices and a 60% correlation with the three-month-on-three month change in equity prices, the latter achieved with the PMI acting with a lead of one month.
Calculating a PMI-based GDP proxy, or 'nowcast'
The PMI data therefore offer investors an indicator of economic growth conditions which is historically more highly correlated with equity market prices than GDP. Moreover, the PMI is available months before GDP data are available, and is not subject to revision.
One downside is that the PMI is expressed as a diffusion index, with values varying around the no-change level of 50. Readings above 50 signal an increase in global output on the prior month and values below 50 signal a drop in output. The greater the variance from 50, the greater the rate of change signalled.
This index methodology means the PMI's movements can be difficult to explain and relate to other variables. However, it is a relatively simple process to covert the PMI into economic growth rate equivalents, essentially calculating a simple 'nowcast' of GDP. This provides an accurate GDP equivalent growth rate from the PMI well in advance of official GDP data becoming available
Converting the PMI into a global growth proxy
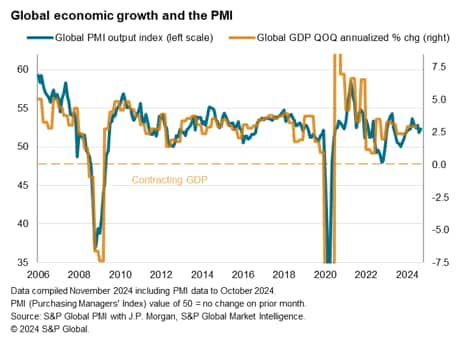
A simple OLS regression can be used to infer a global GDP growth rate from the PMI. The model uses the annualised quarterly rate of change of GDP as the dependent variable and the PMI as the sole explanatory variable. The data from 2008 to the end of 2019 (the pandemic is excluded as this period saw economic growth rates vary considerably from business conditions due to forced shutdowns and government support measures) produce the following formula:
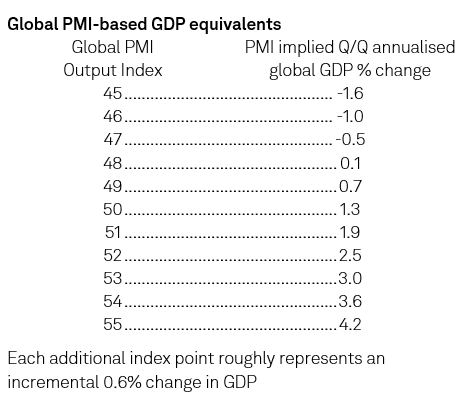
Quarterly change in GDP = (0.582 x PMI) - 27.8
where the PMI refers to the Global PMI Output Index covering goods and services.
Therefore a PMI reading of 50.0 in fact equates to quarterly GDP growth of 1.3%. A PMI reading of 47.8 is comparable to no GDP growth with each index point roughly representing an incremental 0.6% change in GDP. The following chart uses the model to scale the axes, illustrating the relationship of the PMI with GDP. A 'ready reckoner' is also provided below.
Chris Williamson, Chief Business Economist, S&P Global Market Intelligence
Tel: +44 207 260 2329
chris.williamson@spglobal.com
© 2024, S&P Global. All rights reserved. Reproduction in whole
or in part without permission is prohibited.
Purchasing Managers' Index™ (PMI®) data are compiled by S&P Global for more than 40 economies worldwide. The monthly data are derived from surveys of senior executives at private sector companies, and are available only via subscription. The PMI dataset features a headline number, which indicates the overall health of an economy, and sub-indices, which provide insights into other key economic drivers such as GDP, inflation, exports, capacity utilization, employment and inventories. The PMI data are used by financial and corporate professionals to better understand where economies and markets are headed, and to uncover opportunities.
This article was published by S&P Global Market Intelligence and not by S&P Global Ratings, which is a separately managed division of S&P Global.
{"items" : [
{"name":"share","enabled":true,"desc":"<strong>Share</strong>","mobdesc":"Share","options":[ {"name":"facebook","url":"https://www.facebook.com/sharer.php?u=http%3a%2f%2fstage.www.spglobal.com%2fmarketintelligence%2fen%2fmi%2fresearch-analysis%2fusing-the-global-pmi-instead-of-gdp-as-a-macro-indicator-for-investing-nov24.html","enabled":true},{"name":"twitter","url":"https://twitter.com/intent/tweet?url=http%3a%2f%2fstage.www.spglobal.com%2fmarketintelligence%2fen%2fmi%2fresearch-analysis%2fusing-the-global-pmi-instead-of-gdp-as-a-macro-indicator-for-investing-nov24.html&text=Using+the+Global+PMI+instead+of+GDP+as+a+macro+indicator+for+investing+%7c+S%26P+Global+","enabled":true},{"name":"linkedin","url":"https://www.linkedin.com/sharing/share-offsite/?url=http%3a%2f%2fstage.www.spglobal.com%2fmarketintelligence%2fen%2fmi%2fresearch-analysis%2fusing-the-global-pmi-instead-of-gdp-as-a-macro-indicator-for-investing-nov24.html","enabled":true},{"name":"email","url":"?subject=Using the Global PMI instead of GDP as a macro indicator for investing | S&P Global &body=http%3a%2f%2fstage.www.spglobal.com%2fmarketintelligence%2fen%2fmi%2fresearch-analysis%2fusing-the-global-pmi-instead-of-gdp-as-a-macro-indicator-for-investing-nov24.html","enabled":true},{"name":"whatsapp","url":"https://api.whatsapp.com/send?text=Using+the+Global+PMI+instead+of+GDP+as+a+macro+indicator+for+investing+%7c+S%26P+Global+ http%3a%2f%2fstage.www.spglobal.com%2fmarketintelligence%2fen%2fmi%2fresearch-analysis%2fusing-the-global-pmi-instead-of-gdp-as-a-macro-indicator-for-investing-nov24.html","enabled":true}]}, {"name":"rtt","enabled":true,"mobdesc":"Top"}
]}


