Customer Logins
Obtain the data you need to make the most informed decisions by accessing our extensive portfolio of information, analytics, and expertise. Sign in to the product or service center of your choice.
Customer Logins
BLOG
Nov 15, 2021
Weekly Global Market Summary Highlights: November 8-12, 2021
Major European and APAC equity indices closed mixed on the week, while all major US indices were lower. US and benchmark European government bonds closed lower on the week. European iTraxx and CDX-NA closed modestly wider on the week across IG and high yield. The US dollar, gold, copper, and silver closed higher on the week, while oil and natural gas were lower week-over-week.
Americas
All major US equity markets closed lower on the week; S&P 500 -0.3%, DJIA -0.6%, Nasdaq -0.7%, and Russell 2000 -1.0% week-over-week.
10yr US govt bonds closed at a 1.58% yield and 30yr bonds 1.95% yield., which is +11bps and +5bps week-over-week.
DXY US dollar index closed 95.13 (+0.9% WoW).
Gold closed $1,869 per troy oz (+2.8% WoW), silver closed $25.35 per troy oz (+4.9% WoW), and copper closed $4.45 per pound (+2.5% WoW).
Crude Oil closed $80.79 per barrel (-0.6% WoW) and natural gas closed $4.88 per mmbtu (-13.3% WoW).
CDX-NAIG closed 51bps and CDX-NAHY 296bps, which is +3bps and
+8bps week-over-week, respectively.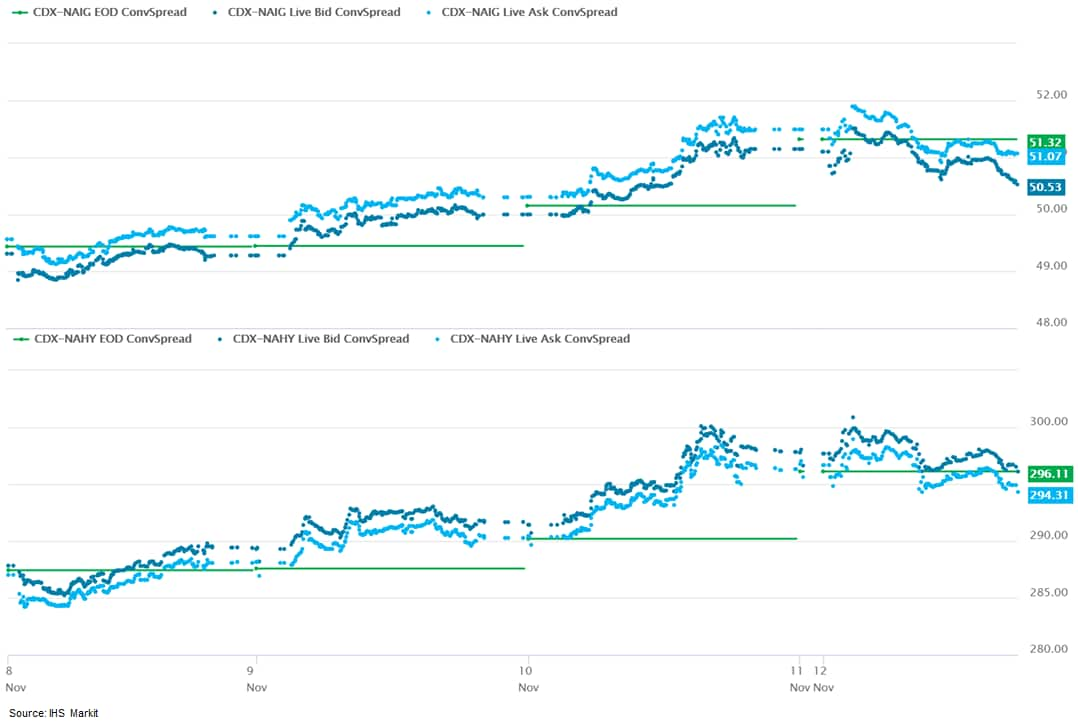
EMEA
Major European equity indices closed mixed on the week; France +0.7%, UK +0.6%, Germany +0.2%, Italy -0.2%, and Spain -0.5% week-over-week.
Major 10yr European government bonds closed sharply lower on the week; Germany closed +2bps, France +4bps, Spain +6bps, UK +7bps, and Italy +8bps week-over-week.
Brent Crude closed $82.17 per barrel (-0.7% WoW).
iTraxx-Europe closed 49bps and iTraxx-Xover 249bps, which is
+1bp and +6bps week-over-week, respectively.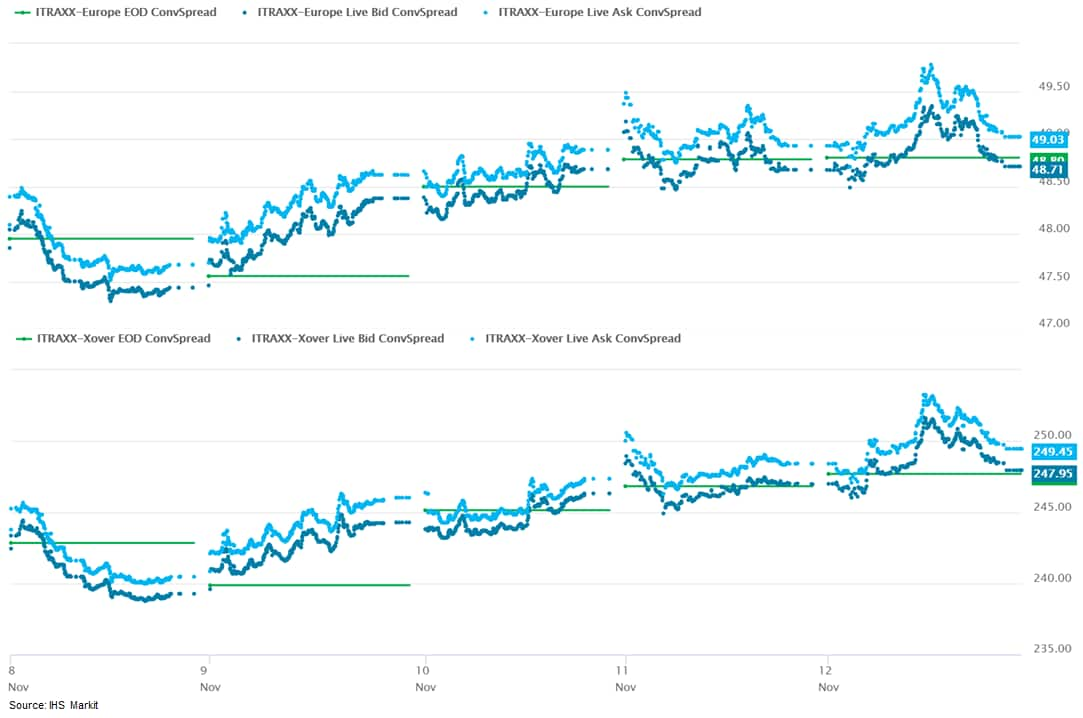
APAC
Major APAC equity markets closed mixed on the week; Hong Kong +1.8%, Mainland China +1.4%, India +1.0%, Japan/South Korea flat, and Australia -0.2% week-over-week.
Monday, November 8, 2021
- Lawmakers in the United States have passed a new infrastructure investment bill, including USD7.5 billion in federal funding for a national network of electric vehicle (EV) chargers. The bill is due to go to President Joe Biden for it to be signed into law. Every expectation is that the president will sign the bill. The bill includes planned US public investment in infrastructure in a number of sectors, with several of the investments particularly relevant to the auto industry. Relative to road infrastructure, the plan includes USD110 billion in additional federal funding for repairing roads and bridges, additional to the traditional funding mechanism already budgeted for this purpose. The USD110 billion is less than the USD159 billion the president had proposed, and the figure has several subcomponents. There is an element in the funding plans for public transportation, including USD39 billion of new investment to modernize public transportation, a figure also less than the amount - USD80 billion - initially proposed. According to the president's statement, "The new investments and reauthorization in the Bipartisan Infrastructure Deal provide USD89.9 billion in guaranteed funding for public transportation over the next five years." The bill maintains a similar level of funding to upgrade airports, ports, and waterways, particularly relevant during the current supply-chain issues, with USD17 billion for port infrastructure and USD25 billion for airports. Relative to EVs, the proposed USD7.5 billion to support a national network of 500,000 chargers in the US was maintained. The bill also earmarks USD65 billion to rebuild the US electric grid, significant as the nation shifts to electricity for more energy needs. For the transition to EVs in the US, the USD7.5-billion funding for a charging network is the most significant element in the bill. (IHS Markit AutoIntelligence's Stephanie Brinley)
- Ball Corporation, the world's leading provider of aluminum
packaging for beverages, announced that its net sales rose to
$10.14 billion in the first nine months, up from $8.68 billion in
the same period of 2020. The corporation's net earnings increased
to $581 million in Q1-Q3 2021, up from $355 million a year ago.
(IHS Markit Food and Agricultural Commodities' Vladimir Pekic)
- Demand for aluminum beverage packaging continues to outstrip supply across North America, according to Ball's third quarter results for 2021.
- The company's new Glendale, Arizona, facility successfully started up its fourth line during the quarter, and the new Pittston, Pennsylvania, facility started up its third beverage can production line late in the third quarter, said the company.
- Ball Corporation said that its additional capacity investments in Nevada and North Carolina will serve long-term committed volume with global and regional strategic customers serving all beverage categories.
- "Demand for our products and technologies continues to outstrip supply and our new facility start-ups are all on track or better relative to our plans," said John A. Hayes, chairman and chief executive of Ball Corporation in the company's Q3 earnings call.
- In the EMEA region, a packaging mix shift to sustainable aluminum cans continues, and demand is outstripping supply. "Intermittent supply chain disruptions across the region were effectively managed during the quarter," said the company.
- Ball added it expects that growing demand for aluminum beverage cans in the remainder of 2021 and beyond will be fully addressed with line speed ups and greenfield projects in the UK, Russia and Czech Republic.
- In Brazil, underlying demand for beverage cans remains strong and customer demand inflected upward in September and is expected to be strong throughout the busy fourth quarter summer selling season.
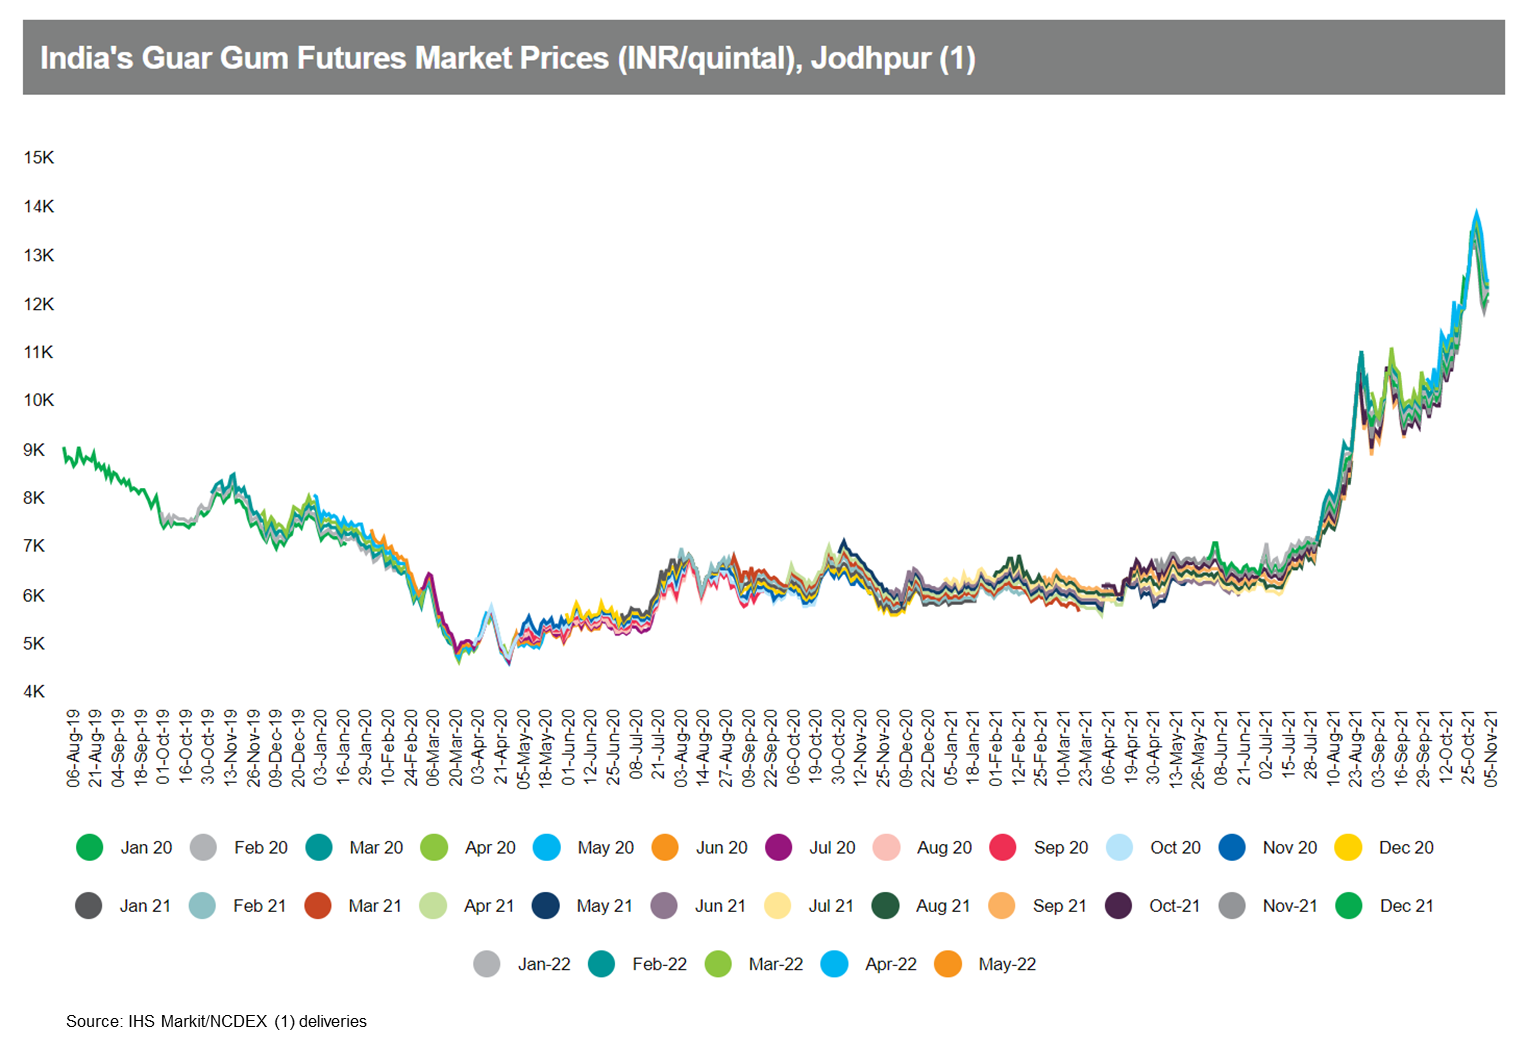
- India's guar gum spot price was INR11,900 per quintal
($160.1/quintal) at the Jodhpur wholesale market on 03 November,
20% more m/m although below the level of INR13,446/quintal reached
on 29 October. Indian exports fell by 1% y/y in volume to 138,000
tons and fell by 6% in value to $178.0 million from January-August
2021. The US, Russia and Germany accounted for 29%, 15% and 13%,
respectively, of the total exported volume. (IHS Markit Food and
Agricultural Commodities' Jose Gutierrez)
- Indonesia's real GDP growth slowed to 3.51% year on year (y/y)
in the third quarter of 2021, down sharply from the 7.07% y/y
expansion recorded in the third quarter of 2020 as the
Delta-variant-driven wave of the COVID-19 infections triggered a
significant ramping up of containment measures. With the measures
easing, a strong rebound is likely in the current quarter, although
weakness in the labor market is a constraint. (IHS Markit Economist
Bree
Neff)
- The pace of economic growth halved between the second and third quarters of 2021, because of the implementation of stricter micro-level public activity restrictions (known locally as PPKM), in response to the quick acceleration in the number of COVID-19 infections as the Delta variant took hold.
- The fact that key industrial sectors such as manufacturing and construction were able to operate during the enhanced PPKM measures, even if at a reduced capacity, was important to sustaining household incomes and spending during the quarter and limited the retrenchment. Growth in mining output was additionally critical to export growth and strong trade surpluses during the quarter.
- Fixed investment activity proved more robust than anticipated
during the quarter, although the pace of growth slowed across the
board, and real investment spending is still down by 6.6%, below
the level recorded in the fourth quarter of 2019. Nevertheless,
investment could have fared worse with building investment managing
to expand by 3.4% y/y, and spending on machinery and equipment
expanding by 11.5% y/y in real terms.

- The Philippine Deposit Insurance Corporation (PDIC) issued a
press release on 5 November, stating that the PDIC and the Bangko
Sentral ng Pilipinas (BSP), the Cooperative Development Authority,
and the Philippine Competition Commission have all signed the
"Memorandum of Agreement on the Procedures for Applications for
Mergers, Consolidations, and Acquisition of Banks". Under the
agreement, the four regulators will reduce the number of
administrative requirements for banks involved in M&A. Chief
among them is the reduction in the number of documents required for
M&A from 58 to 30, with the aim of reducing the application
processing time from 160 days to 55 days. (IHS Markit Banking
Risk's Angus
Lam)
- IHS Markit is not aware of any major M&A activities between Philippine and foreign banks in the last two years and, as such, it is likely that the latest memorandum is catered towards local M&A efforts.
- The last M&A announced was between the state-owned Land Bank of Philippines and the United Coconut Planters Bank; the merger was approved by President Rodrigo Duterte under an executive order in June.
- In the Philippines, banks with different sizes exhibit different financial stability indicators: the largest type, i.e. universal and commercial banks, has the best performance indications, with a non-performing loan (NPL) ratio of 4.1% in August, and their NPL coverage ratio is nearly 90%. However, smaller banks have a starkly different set of performance indicators, with an NPL ratio of 13.7% for rural banks and 17.7% for co-operative banks; their coverage ratio for bad loans stood at 59% and 57%, respectively, in June.
Tuesday, November 9, 2021
- As the pressure to accelerate the energy transition heats up,
there is increasing interest in understanding upstream greenhouse
gas (GHG) competitiveness. While cost is well understood in terms
of the principles that drive better and worse performance, the
factors that shape GHG intensity are less well understood. (IHS
Markit Energy Advisory's Raoul
LeBlanc and GHG Estimation and Coordination's Kevin
Birn)
- GHG emissions intensities are multifaceted - It is not necessarily a simple case of which play is better or worse. Operator behavior matters as well, and as petroleum engineers and geologists have always known, the location within a play or basin is also critical. Process, practices, and productivity all play a role with each one potentially dominating the emission intensity profile. With more and more data emerging, there are several important implications that are worth highlighting:
- Variability can be significant - To date, the public discourse around GHG emission intensity has reflected limitations in data and estimation practices that has resulted in considerable focus on play or even national-level estimates. Comprehensive analysis of entire plays and basins points toward significant differentiation within each play. Take the Permian Basin as an example: when translated to GHG intensity, rock variability means that a typical well in the least geologically productive quintile of a shale play emits two to five times as much GHG per barrel of oil equivalent as the best quintile well. When comparing the many plays of the Permian Basin—and thus including stripper wells and waterfloods—the variation is even greater.
- The "flaw of averages" applies - Aggregating the GHG intensity to the basin, region, or even in some instances company level risks concealing the essential nature of a play's emission profile—the distribution. It is not necessarily the case that the activity in region or country X will be better than region or country Y when the variable nature of GHG intensity points to significant overlap across the groups. As a result, reliance on an average of any grouping of assets rapidly becomes problematic because it does not represent any specific asset. Rather, it can mask the worst performers and detract from the best performers.
- The rich may get richer - Because geologic productivity also determines the economic returns of an oil and gas asset, profitability often aligns with GHG intensity. To put it another way, it is the more productive assets that will tend to have both lower unit costs and GHG intensity because there are more units in the denominator of each calculation. Certainly, there can be important exceptions to this rule, but economics and climate goals tend to pull in the same direction within asset-type groups. This implies that, through the energy transition, the rich may get richer and the poor may get poorer. As the cost of emissions increases—directly via taxation or indirectly through constrained access to capital—the economics of non-core, higher-GHG intensity assets have the potential to be disproportionality impacted. In the United States, private companies own a disproportionate share of these lower productivity (and thus likely more GHG-intensive) assets.
- Mainland China's central bank is launching a structural
carbon-reduction support tool to motivate more social capital to
support the country's long-term decarbonization goals, according to
a statement by the People's Bank of China (PBOC) on 8 November.
(IHS Markit Economist Yating
Xu)
- Financial institutions can apply for low-cost funding from the PBOC with a one-year lending rate at 1.75% to support 60% of their green loans, which refers to clean energy, energy saving and environmental protection and decarbonization in particular. The loans can be rolled over twice.
- The carbon-reduction support tool is a long-term discussed measure to promote the decarbonization goals, which are expected to boost investment in green areas. The central bank has emphasized several times of such a targeted tool since the first quarter monetary report this year.
- Targeted credit and monetary easing are likely for the carbon-reduction support tool. According to the PBOC, the balance of green loans at the end of the third quarter was CNY3.8 trillion, up CNY710 billion from the same period last year. Based on this, green loans are expected to increase CNY1 trillion in the coming year, indicating CNY600 billion of liquidity injection from the central bank.
- General interest rate cut and flood irrigation remain unlikely given the corporate deleveraging and real estate de-risking targets. The rising producer price index (PPI) and global monetary tightening trend also raise concern for the government to ease monetary policy. Targeted monetary and credit easing as well as fiscal support could be preferred choices for cross-cyclical adjustment policies during the 14th five-year-plan.
- US producer prices for final demand increased 0.6% in October
after rising 0.5% in September, and rose 8.6% from a year earlier.
Food prices, up 2.0% in September, flagged by 0.1% in October.
Energy prices, which climbed 2.8% in September, surged another 4.8%
in October. All other producer prices rose 0.4%. (IHS Markit
Economist Michael Montgomery)
- Final demand prices for services grew 0.2% once again, as in September. Retail and wholesale trade margins climbed thanks to large margin gains at motor vehicle dealers. Transportation and warehousing prices climbed 1.7% because of freight rates. The "other" services complex faltered in price thanks to a drop in brokerage charges.
- The rise in energy prices was almost across the board, but electricity prices bucked the trend by sagging 0.3% in October to partially reverse a 2.0% gain the prior month. Oil and oil product price gains ranged from double-digit percentages for propane and heating oil (and diesel) to more modest 6.7% gasoline increases. None of those should surprise buyers of those items as they happened during major distortions from Hurricane Ida that still overhang energy markets.
- Bottom line: Inflationary pressures persisted once again because of bottlenecks, supply shortages, and strong demand in addition to the usual number of special forces. The Hurricane Ida distortion continues to haunt energy markets, as does OPEC+ oil production that is leaner than announced plans.
- US equity investor risk appetite improved for a second month
running in November, rising to the highest since April.
Expectations of near-term returns meanwhile hit a new high, fueled
by improved prospects for earnings, equity fundamentals and
shareholder returns, as well as brighter outlooks for macro and
policy factors. (IHS Markit Economist Chris
Williamson)
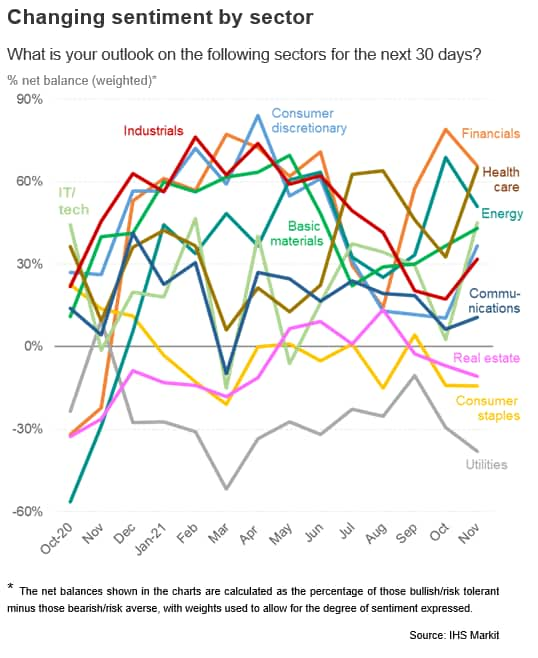
- The Risk Appetite Index from IHS Markit's Investment Manager Index™ (IMI™) monthly survey, which is based on data from around 100 institutional investors each month, rose from +7% in October to +36% in November, its highest since the survey peak of +54% seen back in April 2021. As such, the survey indicates a substantial improvement from the near-evaporation of risk appetite recorded back in September.
- The swelling of risk appetite was accompanied by a marked uplift in investors' expectations of market returns over the coming month to a survey high, surpassing the prior (April) peak by a wide margin and building further on the improvement seen in October.
- By comparison, the survey's Expected Returns Index had fallen to -12% in September, which preceded the brief market fall, before rising again to signal to a marked turnaround in sentiment which has gathered momentum over the past two months. The index has now risen to +38%.
- The biggest drivers of the market in the near-term are considered to be equity fundamentals and shareholder returns, the former viewed as the most supportive since August and the latter seen as more supportive than at any time over the 14-month survey history.
- Economy hopes meanwhile lifted sentiment towards consumer
discretionary, industrial and basic materials, though in some cases
inflation and supply line worries continued to constrain appetite.
Utilities, real estate and consumer staples are seeing ongoing
bearish sentiment.
- IHS Markit anticipates that the automotive market will be
constrained substantially by semiconductor supply shortages not
just for the next several months but for all of 2022 and into 2023
as well. The automotive industry is struggling to cope with a
semiconductor shortage that is having an impact on industry volumes
as severe as a deep global economic recession. IHS Markit's
automotive production tracker reached a tally of 9.2 million
cumulative units of lost production as of 30 October. The
difference from a recession is that this particular crisis comes
from the inability to supply the market with products, rather than
a lack of demand. It is a stark difference. It means that virtually
the entire auto market worldwide is supply-constrained, which has
never happened before in peace time. At run-rates recorded in
September and October, vehicle supply looks to be 15% to 20% below
potential global demand (perhaps as many as one in every six cars
ordered could not be delivered, even with a one-year wait). By the
end of this year, global vehicle stocks will be almost 60% below
normalized inventory levels. In response to the uncertainty
inherent in these immense challenges, IHS Markit Automotive is
redesigning several of its forecasting procedures. The first of
these is to make the electrification path of the industry a core
and integrated driver of our forecasts. Here, electrification of
vehicles is not just a simple powertrain split but a core
determinant of the future market performance of the model itself.
In summary (IHS Markit AutoIntelligence's Ian Fletcher):
- This is a deep supply-side crisis with a potentially long tail to normalization.
- Inventory will be slow to rebuild.
- Competitive metrics in the short term will be determined by supply-side factors, not normal demand indicators.
- The forecasting process has been distorted and IHS Markit is adapting to that.
- Supply conditions will improve significantly in our base case from the depths of the situation in the third quarter of 2021.
- The ending of substantial supply constraints by late 2023 opens the prospect of a strong market with high industry volume lasting into early 2026, provided other supply constraints do not come to the fore.
Wednesday, November 10, 2021
- The US CPI rose 0.9% in October following a 0.4% increase in
September. The core CPI, which excludes the direct effects of moves
in food and energy prices, rose 0.6% in October after a 0.2%
increase in September. Both increases were well above expectations.
The headline CPI was boosted by price increases for food (0.9%) and
energy (4.8%). (IHS Markit Economists Ken
Matheny and Juan
Turcios)
- The rise in consumer prices in October was broad based. Notable increases occurred for used vehicles (2.5%), new vehicles (1.4%), and shelter (0.5%). The price of new vehicles rose for the seventh consecutive month and is up 10.1% since February. Severe supply-chain bottlenecks have resulted in extraordinarily lean inventories and encouraged dealers to raise prices. Used car prices increased in October following two months of de-clines. The ongoing supply issues in new vehicles has shifted demand to used vehicles and placed renewed upward pressure on used car prices.
- Rent inflation is starting to pick up, as the recent surge in house prices is translating into higher rents. Owners' equivalent rent (OER) rose 0.4% for the second consecutive month. Rent of primary residence (RPR) rose 0.4% in October after increasing 0.5% in September, the largest increase in two decades. At 3.1% for OER and 2.7% for RPR, annual (12-month) rent inflation readings in October were low in a broad historical context, but have moved up from 2.4% and 1.9% since July, respectively.
- The twelve-month change in the overall CPI increased to 6.2%, the highest reading since November 1990, while the twelve-month change in the core CPI increased to 4.6%, the highest reading since August 1991. We anticipate that 12-month inflation readings will moderate over the course of 2022 as base effects recede and supply-chain issues are addressed.
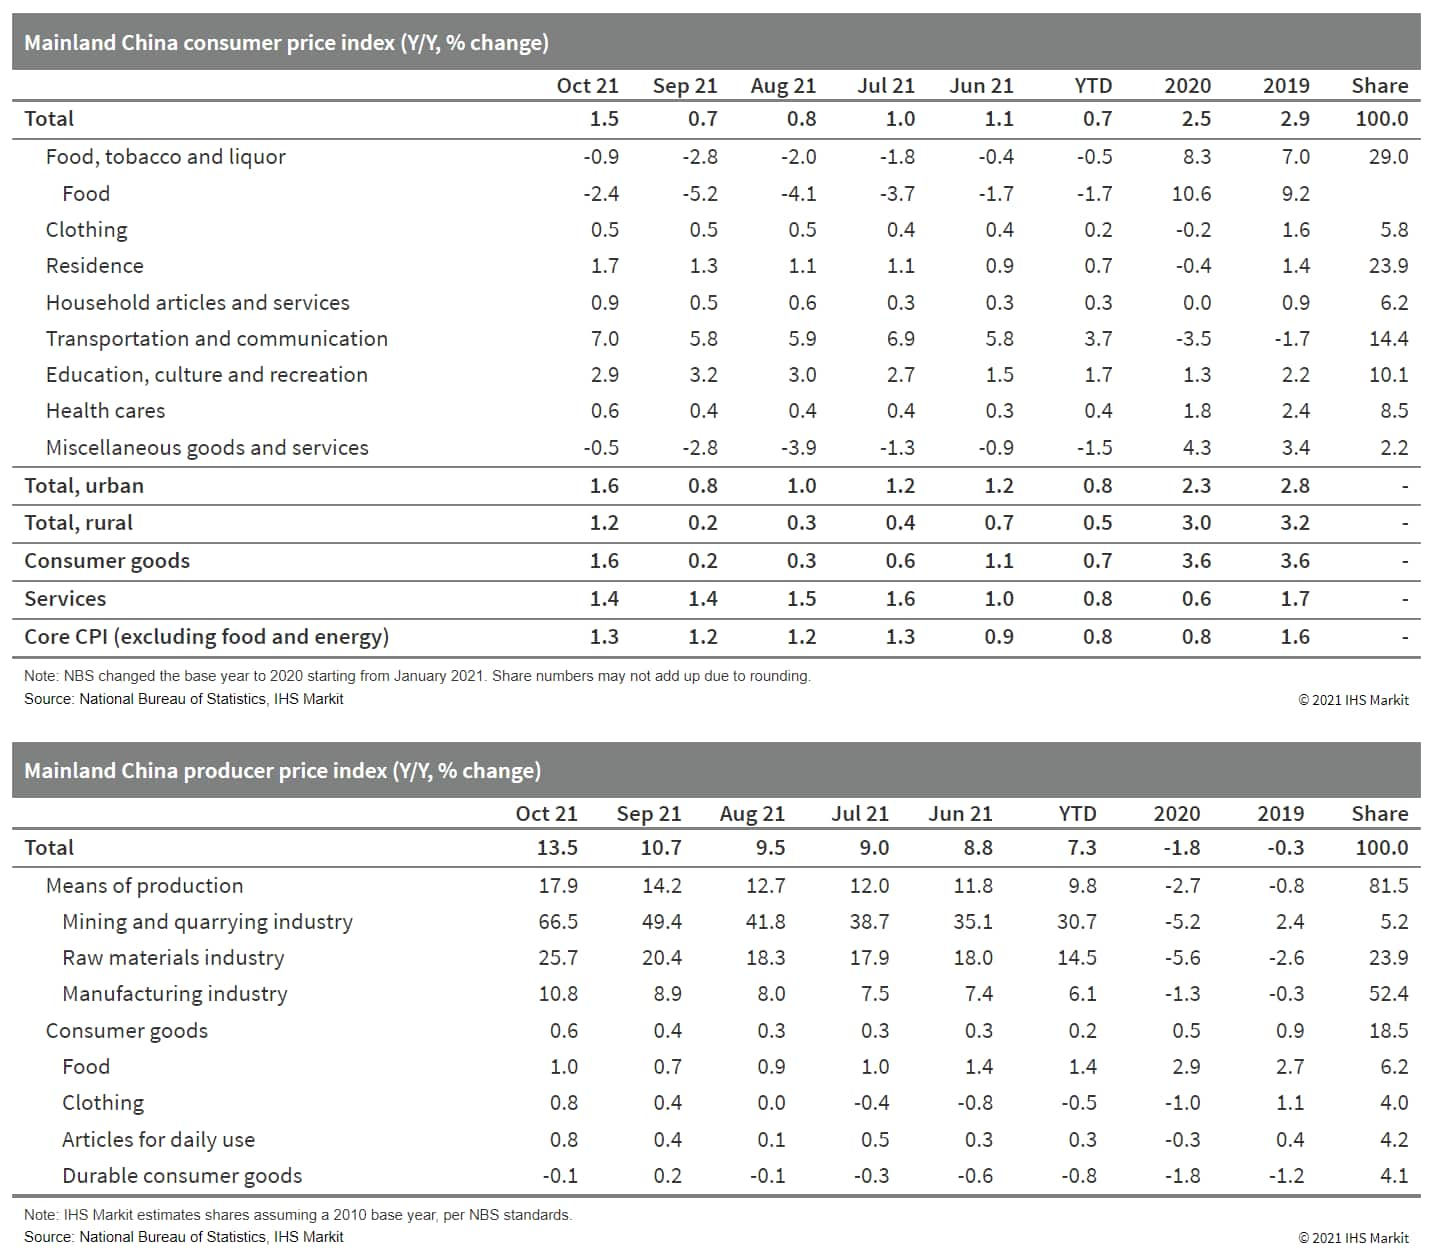
- Mainland China's consumer price index (CPI) rose by 1.5% year
on year (y/y) in October, up by 0.8 percentage point from the
September reading, according to the National Bureau of Statistics
(NBS). Month-on-month (m/m) CPI inflation reached 0.7%, higher by
0.7 percentage point from the prior month. (IHS Markit Economist Lei Yi)
- Narrowed food price deflation was the main driver for the uptick in October headline CPI inflation. Compared with the 5.2% y/y drop in food prices in September, October food price deflation only came in at 2.4% y/y. Notably, pork price deflation narrowed by 2.9 percentage points to 44.0% y/y thanks to rising seasonal demand and the government's price support measures (i.e. purchasing pork for state reserves). Furthermore, with rainfall and pandemic situations disrupting supply, prices of fresh vegetables jumped by 15.9% y/y in October, compared with a 2.5% y/y decline in the prior month.
- Non-food prices ticked up in October by 0.4 percentage point to 2.4% y/y as vehicle fuel prices continued to surge. Despite the week-long National Day holiday at the beginning of October, resurgence of COVID-19 infections dampened travel demand recovery, leaving services price inflation unchanged at 1.4% y/y. Excluding the volatile food and energy components, core CPI ticked up by 0.1 percentage point to 1.3% y/y.
- The Producer Price Index (PPI) surged by 13.5% y/y in October, up by 2.8 percentage points and setting a new record high. Month-on-month PPI inflation registered 2.5%, rising by 1.3 percentage points from the month-ago reading.
- Rising crude oil prices and persistently tight coal supply resulted in the October PPI inflation increase. With energy-intensive industries being the target of power rationing, their output price gains also expanded further. According to the NBS, 11.38 percentage points out of the 13.5% y/y increase in October PPI—which is over 80%—should be attributed to 8 out of the 41 surveyed industries, including coal mining and dressing, petroleum and natural gas extraction, fuel processing, non-ferrous and ferrous metal smelting and pressing, raw chemical materials and chemical products, chemical fiber, and non-metal mineral products.
- Cumulatively, CPI and core CPI had been up by 0.7% y/y and 0.8%
y/y, respectively, in the first 10 months of 2021; year-to-date PPI
inflation had surged to 7.3% y/y through October, up by 0.6
percentage point from September.
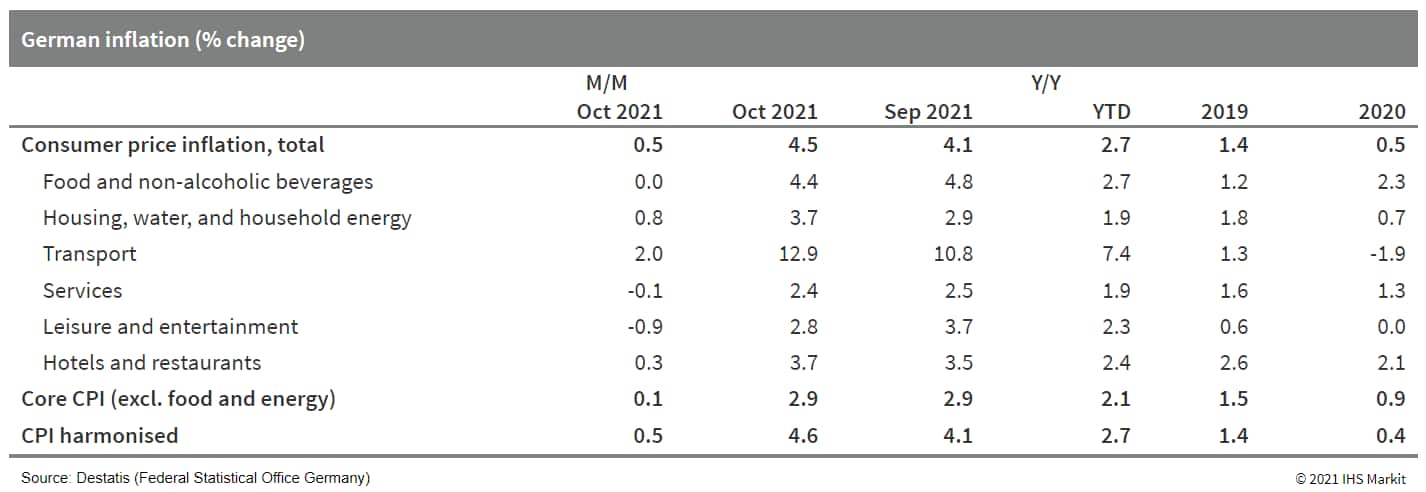
- Final October data based on national methodology from Germany's
Federal Statistical Office (FSO) confirm the 'flash' data release
of 28 October, showing consumer price index (CPI) inflation rates
of 0.5% month on month (m/m) and 4.5% y/y. The latter is up from
September's 4.1% y/y and has not been this high since 1993, then
related to reunification. It contrasts starkly with average
inflation of 1.5% in 2019 and 0.5% in 2020. (IHS Markit Economist
Timo
Klein)
- The EU harmonized CPI measure equally increased by 0.5% m/m, raising its annual rate from 4.1% to a 29-year high of 4.6% y/y. This continues to exceed the eurozone average (4.1%). The divergence between the harmonized and the national measures observed during the first eight months of 2021, owing to differences in the weighting pattern, has largely disappeared since September.
- Unlike the headline measure, the national core CPI rate (excluding food and energy) remained steady at 2.9% y/y in October. Nevertheless, this was more than twice as high as the 1.4% average during January-April, not to mention the December 2020 level of 0.4%. Although this partly owes to the temporarily lower value-added tax (VAT) rate during July-December 2020, an effect that will unwind in January 2022, strong upward pressures persist at the data edge. These are caused by this year's surge in energy prices (including not just oil but also natural gas and electricity) and much higher prices for commodities and intermediate goods owing to global supply-chain bottlenecks. The demand boost related to the loosening of pandemic-related restrictions since May has been contributing too, as companies are able to pass on their higher costs fairly easily because consumers have a strong urge to satisfy their pent-up demand.
- Specifically, energy prices increased sharply by 4.0% m/m in
October, boosting their annual rate from September's 14.3% to
18.6%. Along with higher food price inflation, this raised the y/y
rate for goods from 6.1% to 7.0%, whereas its service-sector
counterpart actually softened slightly from 2.5% to 2.4%.
- The food supply chain may overtake farming as the largest
contributor to greenhouse gases (GHGs) from the agri-food and land
use sector in many countries. A new report from the Food and
Agriculture Organization of the United Nations (FAO) found that the
increase in food processing, packaging, transport, retail,
household consumption, waste disposal and manufacturing of
fertilizers has seen the sector's emissions growth shift away from
farmers. (IHS Markit Food and Agricultural Policy's Steve Gillman)
- "The most important trend over the 30-year period since 1990 highlighted by our analysis is the increasingly important role of food-related emissions generated outside of agricultural land, in pre- and post-production processes," said FAO senior statistician Francesco Tubiello, who led the study.
- The FAO researchers said that of the 16.5 billion tons of emissions from global agri-food systems in 2019, 7.2 billion tons came from within the farm gate, 3.5 from land use change, and 5.8 billion tons from supply-chain processes.
- Their report explains that these agri-food system emissions from land use changes - such as turning forests into cropland - decreased by 25% since 1990, while emissions within the farm gate increased by 9%, which the FAO said highlights how supply-chain factors are now driving the increase in overall emissions of the sector.
- Tubiello adds their findings will have "important repercussions for food-relevant national mitigation strategies, considering that until recently these have focused mainly on reductions of non-CO2 within the farm gate" and land use change.
- Ørsted has proposed a 3.9 GW offshore wind project off the port city of Hai Phong, Vietnam, estimated to cost around USD11.9 billion to 13.6 billion. The project, located offshore 14 kilometers southeast of Bach Long Vy island and 36 kilometers northwest of the Long Chau archipelago, will be developed in three phases, and may feature 20 MW capacity offshore wind turbines. The project will be the largest offshore wind project planned in Vietnam, surpassing that of Enterprize Energy's 3.4 GW Thang Long project. (IHS Markit Upstream Costs and Technology's Melvin Leong)
- Motional and Lyft have selected Las Vegas, Nevada (United States), as the first city for their deployment of fully driverless robotaxis in 2023. The decision follows extensive testing of driverless robotaxis in the city. Motional says this will be the first time that fully driverless robotaxis will be available for rides to member of the public in Nevada, which suggests none of the other companies looking to deploy robotaxis in 2022 or 2023 are looking at Las Vegas. As previously announced, Motional's vehicle is to be based on the Hyundai Ioniq5 electric vehicle. The first vehicles are to be deployed in 2022, and the companies plan to scale up to a "full-fledged commercial launch" in 2023. The Lyft app will have a fully customized self-driving interface, in addition to Lyft options that customers are already familiar with. (IHS Markit AutoIntelligence's Stephanie Brinley)
Thursday, November 11, 2021
- Ford researchers have invented a patent-pending method of cooling cables at electric vehicle (EV) charging stations, potentially reducing charging times. The work was undertaken in collaboration with researchers at Purdue University in West Lafayette, Indiana (United States). According to a company statement, the new technology uses liquid as an active cooling agent, extracting heat as the liquid changes to vapor and potentially enabling higher current. Ford believes that the new technology, in combination with in-development vehicle charging technology, could reduce average EV recharging times. Michael Degner, senior technical leader, Ford Research and Advanced Engineering, said, "Today, chargers are limited in how quickly they can charge an EV's battery due to the danger of overheating. Charging faster requires more current to travel through the charging cable. The higher the current, the greater the amount of heat that has to be removed to keep the cable operational." The key difference between the new technology Ford and Purdue are working on and current liquid-cooled technology is that the cable uses liquid as an active cooling agent, which can help extract more heat from the cable as it changes from liquid to vapor. Although the automaker provided no specific timeline on when the technology might be commercialized, Ford said it could "one day" deliver more power than today's re-charging systems and could "eventually lead to recharging EVs as quickly as conventional gas station fill-ups". (IHS Markit AutoIntelligence's Stephanie Brinley)
- Daimler Truck and TotalEnergies have signed a formal agreement under which the two companies will collaborate on creating a hydrogen fuel-cell network to fuel hydrogen trucks, according to a company statement. The partners will "collaborate in the development of ecosystems for heavy-duty trucks running on hydrogen, with the intent to demonstrate the attractiveness and effectiveness of trucking powered by clean hydrogen." The collaboration will focus on hydrogen sourcing and logistics, delivering hydrogen in service stations, development of hydrogen-based trucks, and building a potential customer base for the vehicles. Daimler Truck CEO Karin Rådström said, "We are fully committed to the Paris Climate Agreement, and we want to actively contribute to the decarbonization of road freight transport in the European Union. Regarding the long-haul freight segment, we are convinced that CO2-neutral transportation will be enabled in the future by hydrogen-powered fuel cell trucks as well as purely battery-powered trucks. In order to make this possible, we want to establish a pan-European hydrogen ecosystem together with strong partners such as TotalEnergies. I am fully convinced that this collaboration will play a key role in our intensified activities on the road toward hydrogen-powered trucking." (IHS Markit AutoIntelligence's Tim Urquhart)
- Siemens Gamesa Renewable Energy (SGRE), part of Siemens Energy,
has developed a project capable of producing green hydrogen
directly from wind, independently from the grid, in so called
"island mode". The plant can also operate connected to the grid.
The Brande Hydrogen pilot project in Denmark is producing its first
green hydrogen as part of the testing and commissioning phase.
Project partner Everfuel now distributes it to hydrogen stations in
Denmark, enabling a growing number of zero emission vehicles, such
as fuel cell taxis, to operate on a 100% green fuel supply. (IHS
Markit Upstream Costs and Technology's Kamila
Langklep)
- Earlier in 2021, the Danish authorities granted SGRE's Brande Hydrogen test site status as official regulatory test zone, allowing activities to operate outside the existing electricity regulations and enabling research into how to develop an island-mode capable system of offshore hydrogen production at turbine level.
- The Brande Hydrogen setup couples an existing onshore SGRE wind turbine with an electrolyzer stack from electrolysis partner Green Hydrogen Systems. SGRE is also using the Brande Hydrogen site to explore whether integrating new battery technology as an upgrade to the co-located turbine and electrolyzer can contribute to grid stability and help address issues around the variability of wind. This combination has the potential to expand the output of existing wind projects. Batteries can store energy in a way that allows electrolyzers to run for longer and produce more green hydrogen. If there is a grid connection, the batteries can distribute the renewable energy to the grid rather than the electrolyzer when conditions allow, easing bottlenecks and providing flexibility.
- The battery, turbine and electrolyzer setup has the potential to enable the production of industrial-scale volumes of green hydrogen in the near term. Innovations and learnings from the Brande Hydrogen test site will be shared with partners to build use cases for larger-scale green hydrogen production.
- Belize completed its cash tender offer to repurchase USD553
million of its 2034 issue at a discount, which it described as
reducing its indebtedness by "approximately USD250 million
(representing approximately 12% of Belize's GDP)". (IHS Markit
Economist Brian
Lawson)
- The repurchase was at 55% of nominal value, with 87% of bondholders having agreed to participate in the tender.
- The remaining bondholders, reported by BBN agency as being largely from Venezuela, will now be forcibly repaid under the bond's collective action clause, but without accrued interest.
- On 5 November, it announced settlement of the transaction using funds "provided by a subsidiary of The Nature Conservatory" (TNC) as part of the latter's Blue Bonds for Ocean Conservation Program (BBOC).
- The transaction was supported by the United States International Development Finance Corporation (DFC), which provided USD610 million in "political risk insurance" to cover both principal and interest payments on USD364 million of new Blue Bonds.
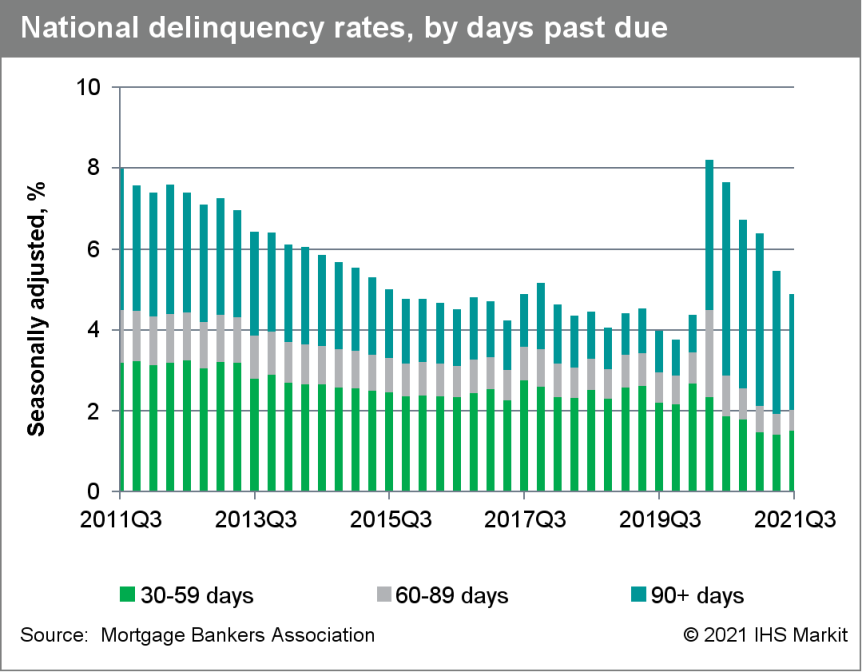
- The US seasonally adjusted delinquency rate fell 59 basis
points from the second quarter and 277 basis points from a year
earlier to 4.88%; it was 3.77% at the end of 2019, the last quarter
not impacted by the pandemic. (IHS Markit Economist Patrick
Newport)
- The serious delinquency rate—loans more than 90 days delinquent or in foreclosure—was 3.40%, down 63 basis points from a year earlier; it was 1.76% in the fourth quarter of 2019.
- The percentage of loans in the foreclosure process was 0.46%, down 13 basis points from a year earlier and the lowest reading since the fourth quarter of 1981.
- The seasonally adjusted 30-day delinquency rate increased 10 basis points to 1.51%; the 60-day delinquency rate was unchanged at a record low 0.52%; the 90-day delinquency rate plunged 68 basis points to 2.85%.
- The seasonally adjusted rate on new foreclosures slipped to a historically low 0.03%—almost zero.
- The largest delinquency rate decreases: Nevada (98 basis points), Hawaii (83 basis points), New Jersey (74 basis points), Maryland (72 basis points), and Connecticut (71 basis points).
- The worst performers: Louisiana (118 basis points increase), Wyoming (3 basis points increase), Iowa (5 basis points decrease), Montana (10 basis points decrease) and West Virginia (14 basis points decrease).
- The key to understanding this report is that the Mortgage
Bankers Association (MBA) considers loans in forbearance to be
delinquent because "the payment was not made based on the original
terms of the mortgage." A forbearance delays, not forgives,
mortgage payments. About 1 million borrowers were on forbearance
plans at the end of October.

S&P Global provides industry-leading data, software and technology platforms and managed services to tackle some of the most difficult challenges in financial markets. We help our customers better understand complicated markets, reduce risk, operate more efficiently and comply with financial regulation.
This article was published by S&P Global Market Intelligence and not by S&P Global Ratings, which is a separately managed division of S&P Global.
{"items" : [
{"name":"share","enabled":true,"desc":"<strong>Share</strong>","mobdesc":"Share","options":[ {"name":"facebook","url":"https://www.facebook.com/sharer.php?u=http%3a%2f%2fstage.www.spglobal.com%2fmarketintelligence%2fen%2fmi%2fresearch-analysis%2fweekly-global-market-summary-highlights-november-15-2021.html","enabled":true},{"name":"twitter","url":"https://twitter.com/intent/tweet?url=http%3a%2f%2fstage.www.spglobal.com%2fmarketintelligence%2fen%2fmi%2fresearch-analysis%2fweekly-global-market-summary-highlights-november-15-2021.html&text=Weekly+Global+Market+Summary+Highlights%3a+November+8-12%2c+2021+%7c+S%26P+Global+","enabled":true},{"name":"linkedin","url":"https://www.linkedin.com/sharing/share-offsite/?url=http%3a%2f%2fstage.www.spglobal.com%2fmarketintelligence%2fen%2fmi%2fresearch-analysis%2fweekly-global-market-summary-highlights-november-15-2021.html","enabled":true},{"name":"email","url":"?subject=Weekly Global Market Summary Highlights: November 8-12, 2021 | S&P Global &body=http%3a%2f%2fstage.www.spglobal.com%2fmarketintelligence%2fen%2fmi%2fresearch-analysis%2fweekly-global-market-summary-highlights-november-15-2021.html","enabled":true},{"name":"whatsapp","url":"https://api.whatsapp.com/send?text=Weekly+Global+Market+Summary+Highlights%3a+November+8-12%2c+2021+%7c+S%26P+Global+ http%3a%2f%2fstage.www.spglobal.com%2fmarketintelligence%2fen%2fmi%2fresearch-analysis%2fweekly-global-market-summary-highlights-november-15-2021.html","enabled":true}]}, {"name":"rtt","enabled":true,"mobdesc":"Top"}
]}


