Estimating Marginal Emissions Rates
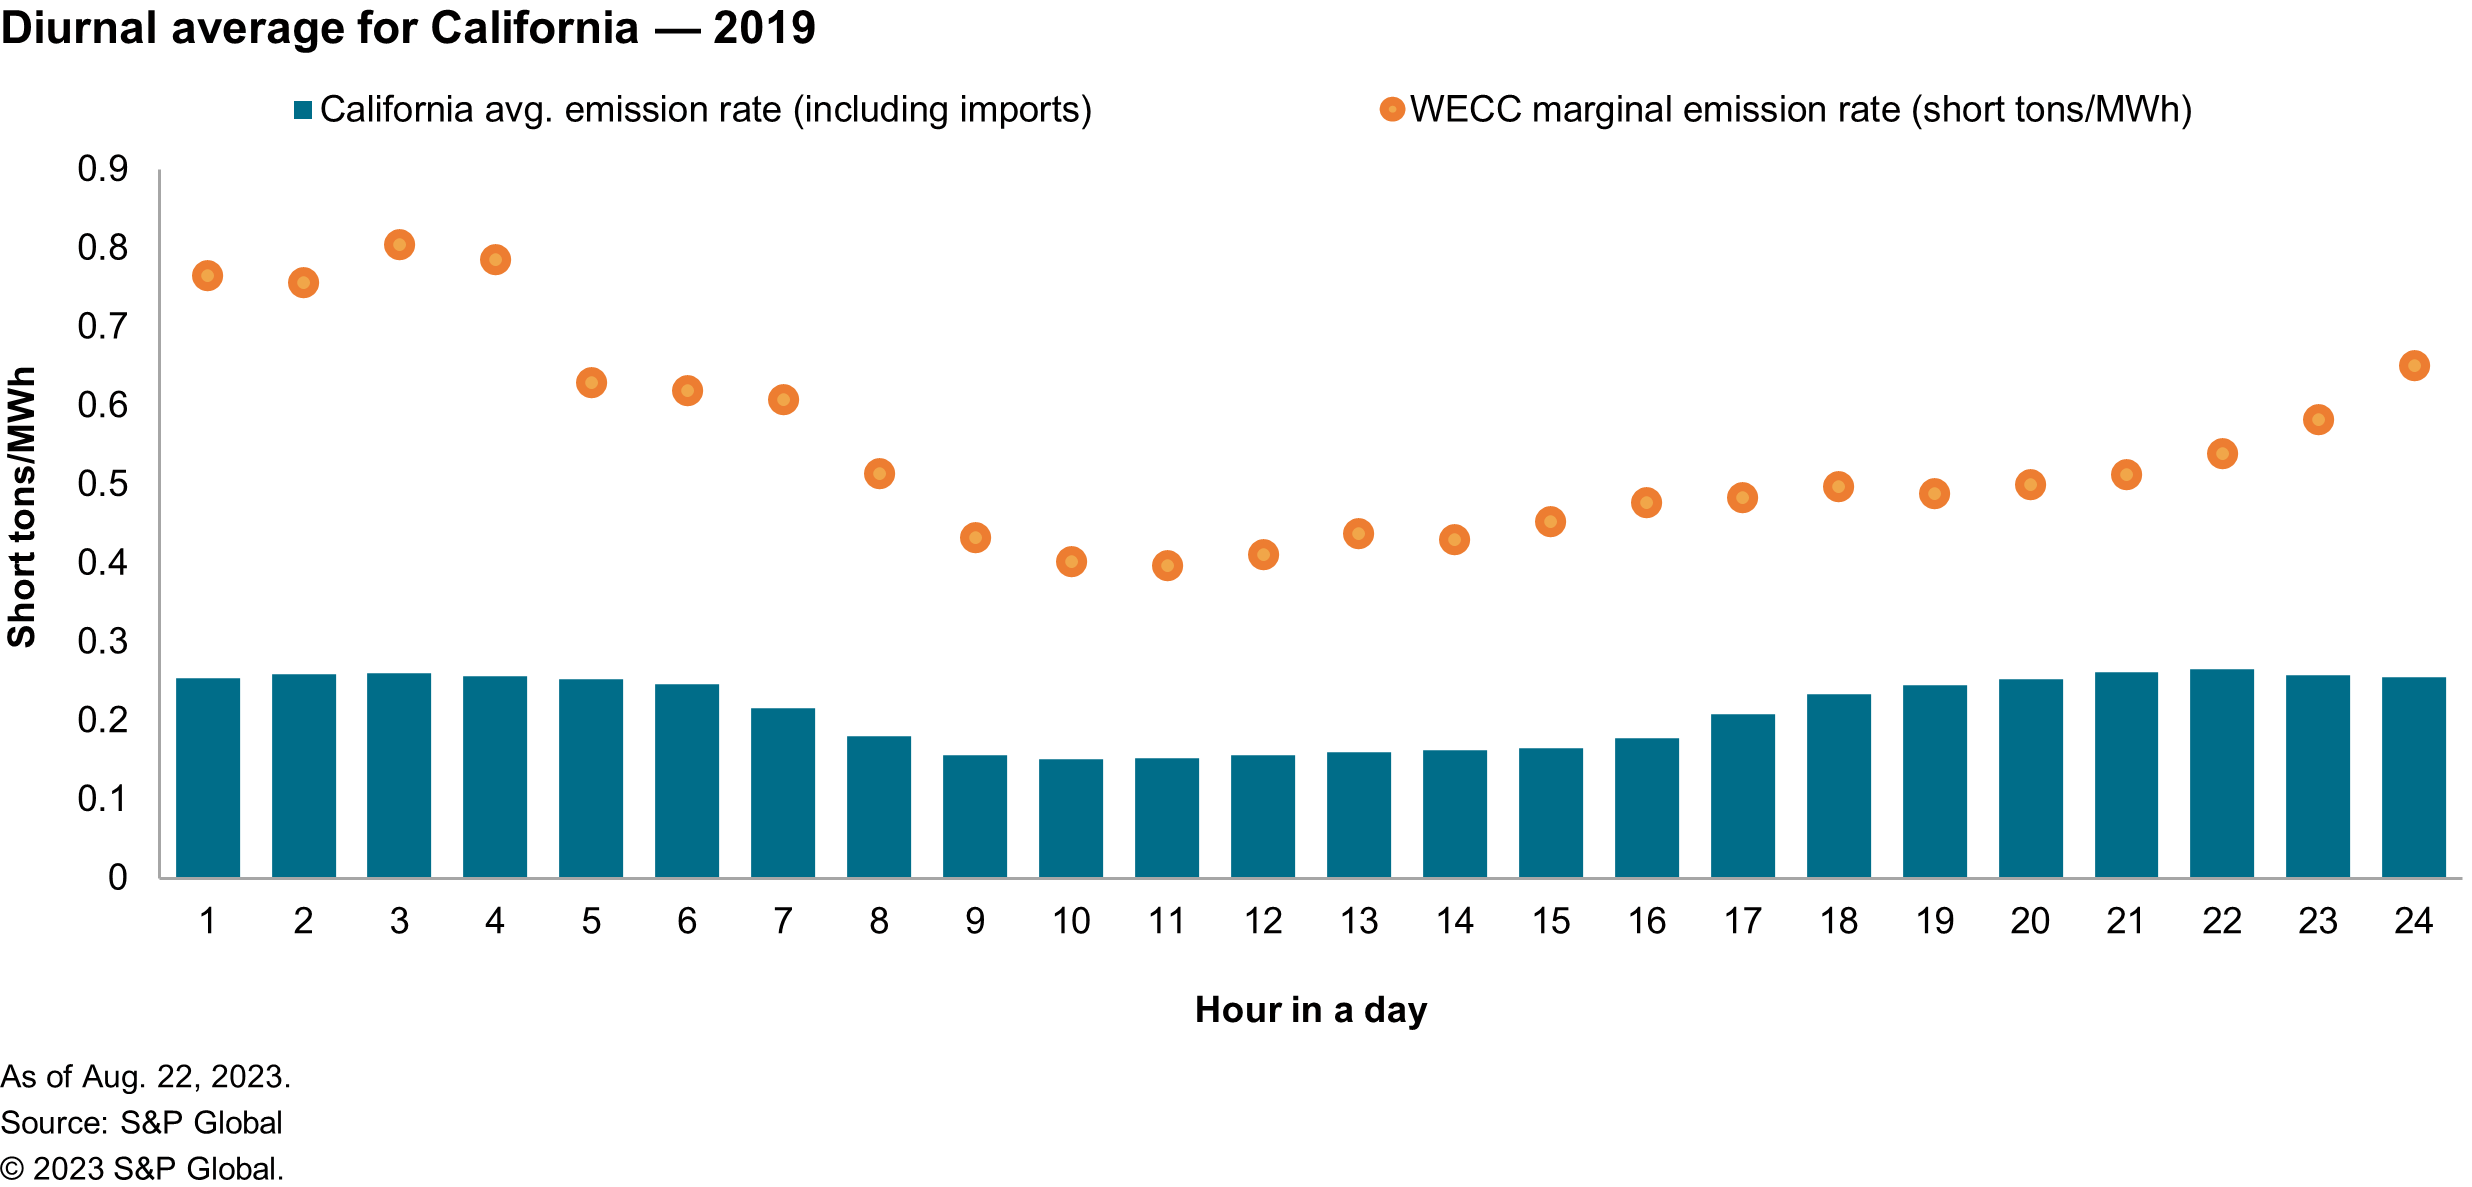
Today, greenhouse gas emissions are a key area of focus across the entire energy landscape, especially in the electric power sector where much of the focus is on the energy transition — from a system largely fueled by the combustion of fossil fuels, to one that is dominated by renewable generation sources. As part of this transition there is a great deal of attention paid to the carbon intensity of different generation sources. On one end of the spectrum, coal and oil fueled generation typically have CO2 emission rates around 1 short ton/MWh of generation, and on the other end of the spectrum renewable generation from wind and solar have emission rates of 0 short tons of CO2/MWh[1]. Natural gas-fired generation tends to fall in the middle with an average of 0.5 short tons/MWh. Calculating the average emission rate for a specific generator or a power system across any given time period is a relatively straightforward procedure of adding up all the CO2 emissions and dividing them by the amount of power produced to derive the average rate. While the average emission rate of a generator or system can be instructive, it can really only describe what was, rather than what would happen with changes to some aspect of the system (e.g., incremental demand). Understanding marginal emission rates is important in evaluating the emission impact of policies and actions, as illustrated in Figure 1. While average emission rates in California are quite low on average across all hours, the marginal emission rates are significantly higher.

This study was commissioned by the Propane Education & Research Council (PERC) to better understand marginal emission rates; the rate at which additional emissions are produced to serve the next increment of demand in any given hour. This is a much less straightforward procedure than the average emission rates, as it requires defining exactly what it means to be marginal in a power system. The overall objective in this paper is to describe the methods used to estimate the marginal CO2 emission rates of power generation for three competitive power markets in the United States in 2019: California, New York ISO (NYISO) and ISO New England (ISO-NE), using the Aurora production cost model[2]. For this analysis we focused on the marginal emission rates associated with an increase in demand on the system, but the same principles and analysis could also be extended to a decrease in demand on the system.
Learn more about our Consulting Services
Authors:
- Chris Wilfong, director with the Gas, Power, and Climate Solutions group, leads S&P Global Commodity Insights power market modeling/analytics in North America.
- Sai Nizampatnam, associate director with the Gas, Power, and Climate Solutions group, manages the power market modeling and nodal power assessments in North America.
- Fidel Gonzalez, consulting principal with the Gas, Power, and Climate Solutions group.
Posted 9 October 2023
_________________
[1] A description of the Aurora model can be found in the appendix to the report
[2] For the purposes of this analysis, the emissions associated with different generation sources is based solely on the emissions associated with power generation rather than the full lifecycle emissions
This article was published by S&P Global Commodity Insights and not by S&P Global Ratings, which is a separately managed division of S&P Global.
