Customer Logins
Obtain the data you need to make the most informed decisions by accessing our extensive portfolio of information, analytics, and expertise. Sign in to the product or service center of your choice.
Customer Logins
ECONOMICS COMMENTARY
Aug 01, 2017
Is UK manufacturing in decline, booming or eking out steady growth?
Recent months have seen a variety of indicators on the health of the manufacturing economy in mid-2017, ranging from the CBI survey showing the fastest output growth for 20 years to Office for National Statistics data depicting one of the steepest declines seen since the global financial crisis. The truth most likely lies somewhere in the middle, with PMI data registering steady, albeit slowing, expansion in recent months.
Mixed signals
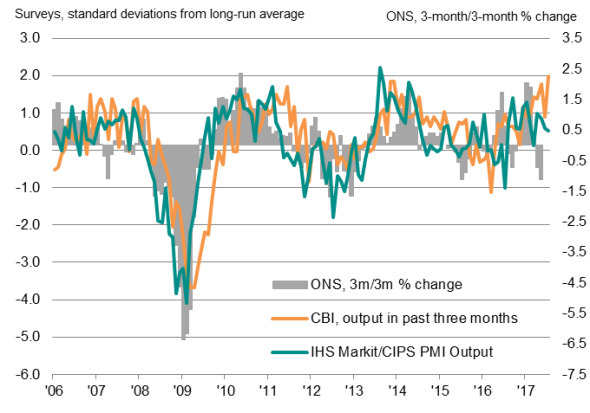
There have been mixed signals on the performance of the UK's factories recently. Survey data from the CBI showed manufacturing output rising at the fastest rate for more than two decades, swiftly followed by official data showing the sector to be in decline. The CBI report found 43% of firms recording an increase in the volume of output in the three months to July while just 12% reported a decline. The net balance of +31% was the highest since January 1995, up from a relatively robust reading of +15% in the three months to June.
The latest ONS data meanwhile estimated that manufacturing output fell 0.5% in the second quarter, a rate of decline only exceeded on four occasions since the global financial crisis.
Manufacturing survey data compared to official output

PMI takes the middle ground
We believe that neither of these contrasting pictures of a sector that is either booming or slumping accurately portray the current state of UK manufacturing. IHS Markit's PMI survey data have indicated continuous manufacturing output growth so far this year, albeit with the rate of growth slipping to a four-month low in July.
PMI respondents have reported that output growth is being supported by rising exports, in turn often linked to the depreciation of the pound over the past year, as well as rising inflows of domestic orders, though growth of the latter appears to have waned recently.
The PMI and CBI survey data are tracked against the ONS data in the first chart, with the surveys transformed into normalized series by calculating standard deviations from long-run averages, to make comparisons easier (the CBI survey is calculated as a net balance, while the PMI is presented as a diffusion index).
Both surveys and the official data all measure output in volume terms. While the surveys ask respondents to directly report on volume terms (though note that the CBI looks at the trend over the latest three months while the PMI just looks at the change in the latest month), the ONS data are collected as the turnover value of production that is then deflated using estimated selling prices to achieve a measure of production volumes.
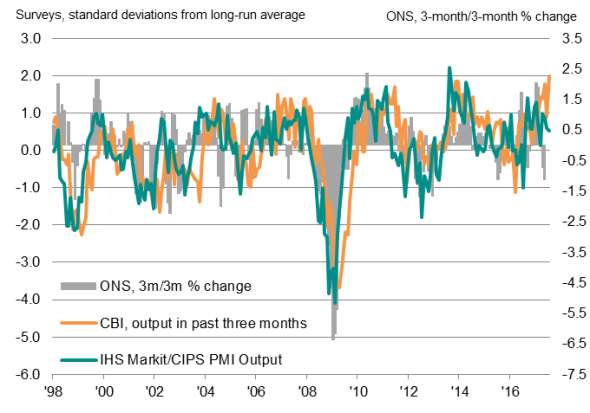
Long-run manufacturing output survey trends

Sources: IHS Markit, CIPS, CBI, ONS
Possible causes of divergences
The possibility that the buoyant CBI readings might simply be providing an advance signal can be dismissed, as history indicates that the survey tends to lag both the official data and the PMI (a longer run of histories is shown in the second chart, which highlights the lag of the CBI survey more clearly).
The strong CBI employers' organisation's readings may be in part a symptom of the survey being biased, reflecting business conditions at larger firms. PMI survey data, which are weighted according to the correct mix of small, medium and large firms, have shown output growth at large and medium sized firms to have been running at twice the speed of smaller firms so far this year, with an even greater divergence evident for exports, for which smaller firms have seen stagnation on average (though even growth in larger firms has cooled in recent months, according to the PMI).
As for the ONS data, and notwithstanding the potential for the data to be revised at a later date, the second quarter downturn needs to be looked at in the context of prior numbers. The high degree of volatility in the data suggest the current weakness may simply reflect some pay-back after especially strong growth in prior months.
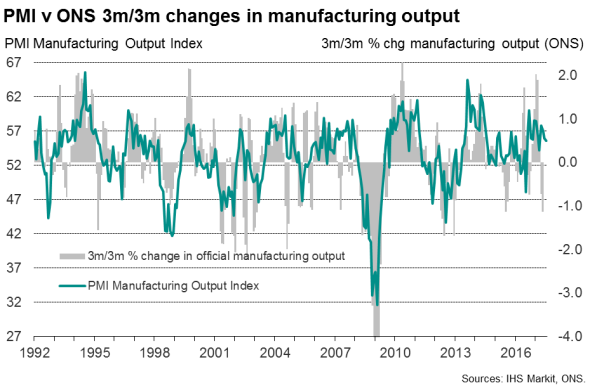
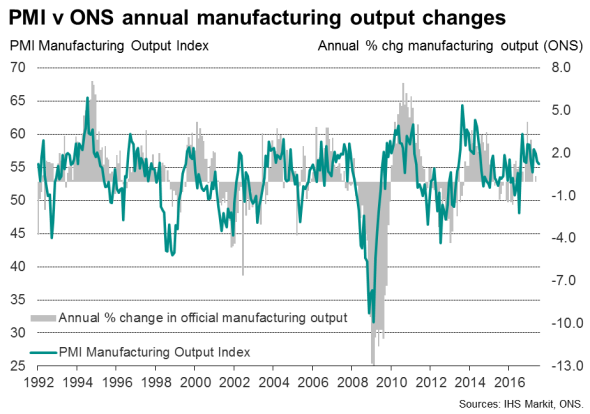
The third chart illustrates how the ONS manufacturing output data is no stranger to volatility, and reveals how frequently the series shows short-snaps of three-month-on-three-month declines which are soon reversed. Over the past 25 years, the three-month-on-three month rate of change in ONS manufacturing output has in fact moved into decline some 32 times, so more than once per year. However, only on eight of these occasions did output fall for two quarters or more. In fact, periods of sustained downturns, the extent to which takes the annual rate of growth of manufacturing output into negative territory, have only ever been recorded when the PMI surveys output index has fallen below 52.6 for more than one month. All other occasions have proved to be brief downturns that have soon been reversed.

The one exception is mid-2016, when a brief decline in the PMI around the EU referendum was followed by a one-quarter contraction in the official data in the third quarter of 2016. In this instance, policy stimulus from the Bank of England and a weaker currency are likely to have helped generate a swift return to growth.
The relationship between the PMI and ONS data therefore suggest that the current weakness in the ONS data is merely another temporary downturn and that a resumption to growth will be seen in the third quarter, providing PMI data remain above 52.6 in August and September.

Chris Williamson | Chief Business Economist, IHS Markit
Tel: +44 20 7260 2329
chris.williamson@ihsmarkit.com
{"items" : [
{"name":"share","enabled":true,"desc":"<strong>Share</strong>","mobdesc":"Share","options":[ {"name":"facebook","url":"https://www.facebook.com/sharer.php?u=http%3a%2f%2fstage.www.spglobal.com%2fmarketintelligence%2fen%2fmi%2fresearch-analysis%2f01082017-Economics-Is-UK-manufacturing-in-decline-booming-or-eking-out-steady-growth.html","enabled":true},{"name":"twitter","url":"https://twitter.com/intent/tweet?url=http%3a%2f%2fstage.www.spglobal.com%2fmarketintelligence%2fen%2fmi%2fresearch-analysis%2f01082017-Economics-Is-UK-manufacturing-in-decline-booming-or-eking-out-steady-growth.html&text=Is+UK+manufacturing+in+decline%2c+booming+or+eking+out+steady+growth%3f","enabled":true},{"name":"linkedin","url":"https://www.linkedin.com/sharing/share-offsite/?url=http%3a%2f%2fstage.www.spglobal.com%2fmarketintelligence%2fen%2fmi%2fresearch-analysis%2f01082017-Economics-Is-UK-manufacturing-in-decline-booming-or-eking-out-steady-growth.html","enabled":true},{"name":"email","url":"?subject=Is UK manufacturing in decline, booming or eking out steady growth?&body=http%3a%2f%2fstage.www.spglobal.com%2fmarketintelligence%2fen%2fmi%2fresearch-analysis%2f01082017-Economics-Is-UK-manufacturing-in-decline-booming-or-eking-out-steady-growth.html","enabled":true},{"name":"whatsapp","url":"https://api.whatsapp.com/send?text=Is+UK+manufacturing+in+decline%2c+booming+or+eking+out+steady+growth%3f http%3a%2f%2fstage.www.spglobal.com%2fmarketintelligence%2fen%2fmi%2fresearch-analysis%2f01082017-Economics-Is-UK-manufacturing-in-decline-booming-or-eking-out-steady-growth.html","enabled":true}]}, {"name":"rtt","enabled":true,"mobdesc":"Top"}
]}


