Customer Logins
Obtain the data you need to make the most informed decisions by accessing our extensive portfolio of information, analytics, and expertise. Sign in to the product or service center of your choice.
Customer Logins
EQUITIES COMMENTARY
May 06, 2015
Risk of burns from TAN
The TAN solar ETF is up 40% year to date, but the performance of this perceived proxy for the solar industry may falter as returns have been driven by the tightly held and heavily shorted Hanergy Energy.
- TAN has performed well year to date due to a single share facing accounting allegations
- Short interest in Hanergy and TAN is high despite Hanergy having rallied 160%
- Cost to borrow TAN soared above 10% as shorting activity peaked
Solar flares
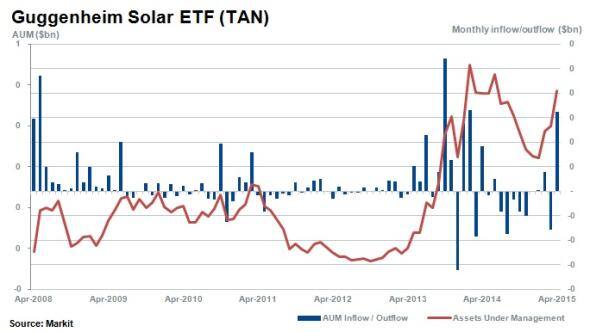
The Guggenheim Solar ETF (TAN) has delivered an astounding performance year to date. The fund's NAV has risen by 40% year to date (ytd) which has helped push its AUM to $460m after a string of outflows occurred in the closing months of 2014. Investors were initially reticent to pile into the fund's recent strong performance but have started to get behind the rally as evidenced by the $50m of inflows seen over April.

Returns driven by Hanergy
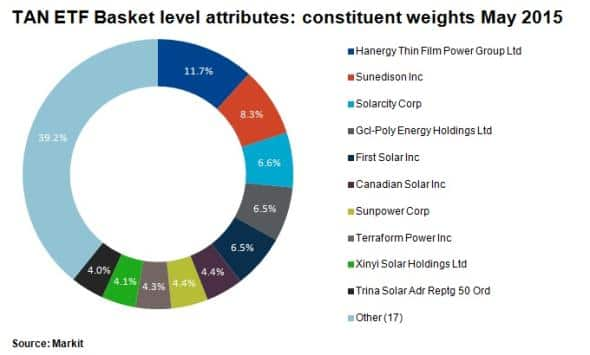
Half of the recent performance in TAN can be attributed to the 157% ytd rise in Hanergy Thin Film Power Group. The subsidiary of private company Hanergy Group, Hanergy Energy now has the largest weighting in the ETF at 11.7% after the controversial share rose dramatically in the last 12 and 24 months.

The constituents of the TAN ETF are relatively concentrated as the largest 10 of its 27 stocks make up around 60% of its total weighting.
Analysing ytd returns reveal that the top ten holdings on average have performed well, with a 45% average return on an equal weighted basis. However excluding the largest constituent Hanergy Energy, average returns are more subdued at 32%. Incorporating the entire basket of securities, average returns are even lower at 13%.
Hanergy in perspective
To put the 2015 rise of Hanergy Energy into perspective; if the stock price was to fall by 50%, this would impact TAN's estimated NAV by a substantial ~6%. This would however still leave Hanergy's stock up 30% year to date, and 230% up over the last 12 months.
Based in Hong Kong, Hanergy supplies solar panel manufacturing equipment predominantly to its private parent company Hanergy Group. Questionable accounting practices have attracted short sellers to the tightly held stock.
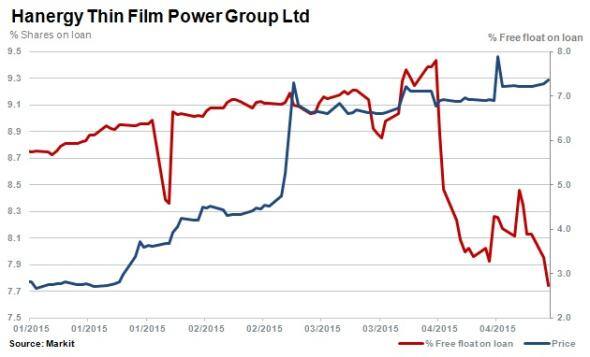
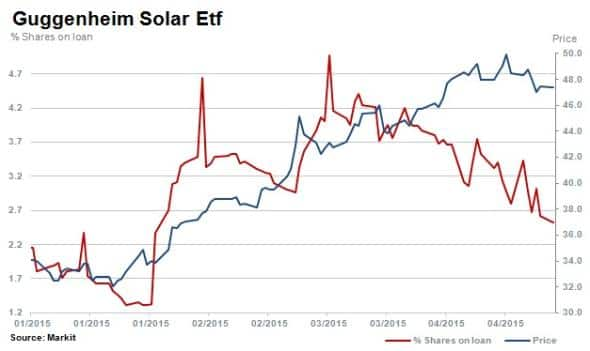
However short sellers' patience may have begun to be tested as covering of positions can be seen in both the single stock and TAN since March 2015. Media speculation of possible price manipulation may be behind the recent decline in shorting levels but demand to borrow remains healthy with 7.7% of free float currently out on loan in the tightly held firm.

Demand to short sell, as measured by the cost to borrow stock, has decreased from highs above 30% in early April to ~20% currently. Hanergy remains the most expensive stock to borrow among TAN constituents, where the average cost to borrow is 3.5%.
The cost to borrow the TAN ETF has increased 238% this year so far from 3.2% to 10.9% currently. This is compared to a 12% increase in the average cost to borrow across the ETF's constituents.

Shining lights
Hanergy's recent rise has investors questioning the legitimacy of the company's fundamentals, but there are other strong solar performers in the sector. Canadian Solar and Sunedison have risen by 40% and 29% respectively in 2015 to date. Markit's Research Signals' factors reveal interesting characteristics of these two solar firms.
Canadian Solar ranks positively for sustainable growth and earnings momentum rates and has seen positive growth in sales as well as in net profit margins in the last 12 months. Based on these factor rankings, the firm's earnings and share price is expected to grow faster than peers. Sunedison has been highly valued by investors according to recent valuation factor ranks compared to its peers. The stock has ranked highly across the following factors; Book-to-Market, trailing 12-month Core Earnings-to-Price and trailing 12-month Sales-to-Price.
Relte Stephen Schutte | Analyst, Markit
Tel: +44 207 064 6447
relte.schutte@markit.com
S&P Global provides industry-leading data, software and technology platforms and managed services to tackle some of the most difficult challenges in financial markets. We help our customers better understand complicated markets, reduce risk, operate more efficiently and comply with financial regulation.
This article was published by S&P Global Market Intelligence and not by S&P Global Ratings, which is a separately managed division of S&P Global.
{"items" : [
{"name":"share","enabled":true,"desc":"<strong>Share</strong>","mobdesc":"Share","options":[ {"name":"facebook","url":"https://www.facebook.com/sharer.php?u=http%3a%2f%2fstage.www.spglobal.com%2fmarketintelligence%2fen%2fmi%2fresearch-analysis%2f06052015-Equities-Risk-of-burns-from-TAN.html","enabled":true},{"name":"twitter","url":"https://twitter.com/intent/tweet?url=http%3a%2f%2fstage.www.spglobal.com%2fmarketintelligence%2fen%2fmi%2fresearch-analysis%2f06052015-Equities-Risk-of-burns-from-TAN.html&text=Risk+of+burns+from+TAN","enabled":true},{"name":"linkedin","url":"https://www.linkedin.com/sharing/share-offsite/?url=http%3a%2f%2fstage.www.spglobal.com%2fmarketintelligence%2fen%2fmi%2fresearch-analysis%2f06052015-Equities-Risk-of-burns-from-TAN.html","enabled":true},{"name":"email","url":"?subject=Risk of burns from TAN&body=http%3a%2f%2fstage.www.spglobal.com%2fmarketintelligence%2fen%2fmi%2fresearch-analysis%2f06052015-Equities-Risk-of-burns-from-TAN.html","enabled":true},{"name":"whatsapp","url":"https://api.whatsapp.com/send?text=Risk+of+burns+from+TAN http%3a%2f%2fstage.www.spglobal.com%2fmarketintelligence%2fen%2fmi%2fresearch-analysis%2f06052015-Equities-Risk-of-burns-from-TAN.html","enabled":true}]}, {"name":"rtt","enabled":true,"mobdesc":"Top"}
]}


